Immigrants from Latin America 1 or more Vehicles in Household
COMPARE
Immigrants from Latin America
Select to Compare
1 or more Vehicles in Household
Immigrants from Latin America 1 or more Vehicles in Household
89.8%
1+ VEHICLES AVAILABLE
60.3/ 100
METRIC RATING
167th/ 347
METRIC RANK
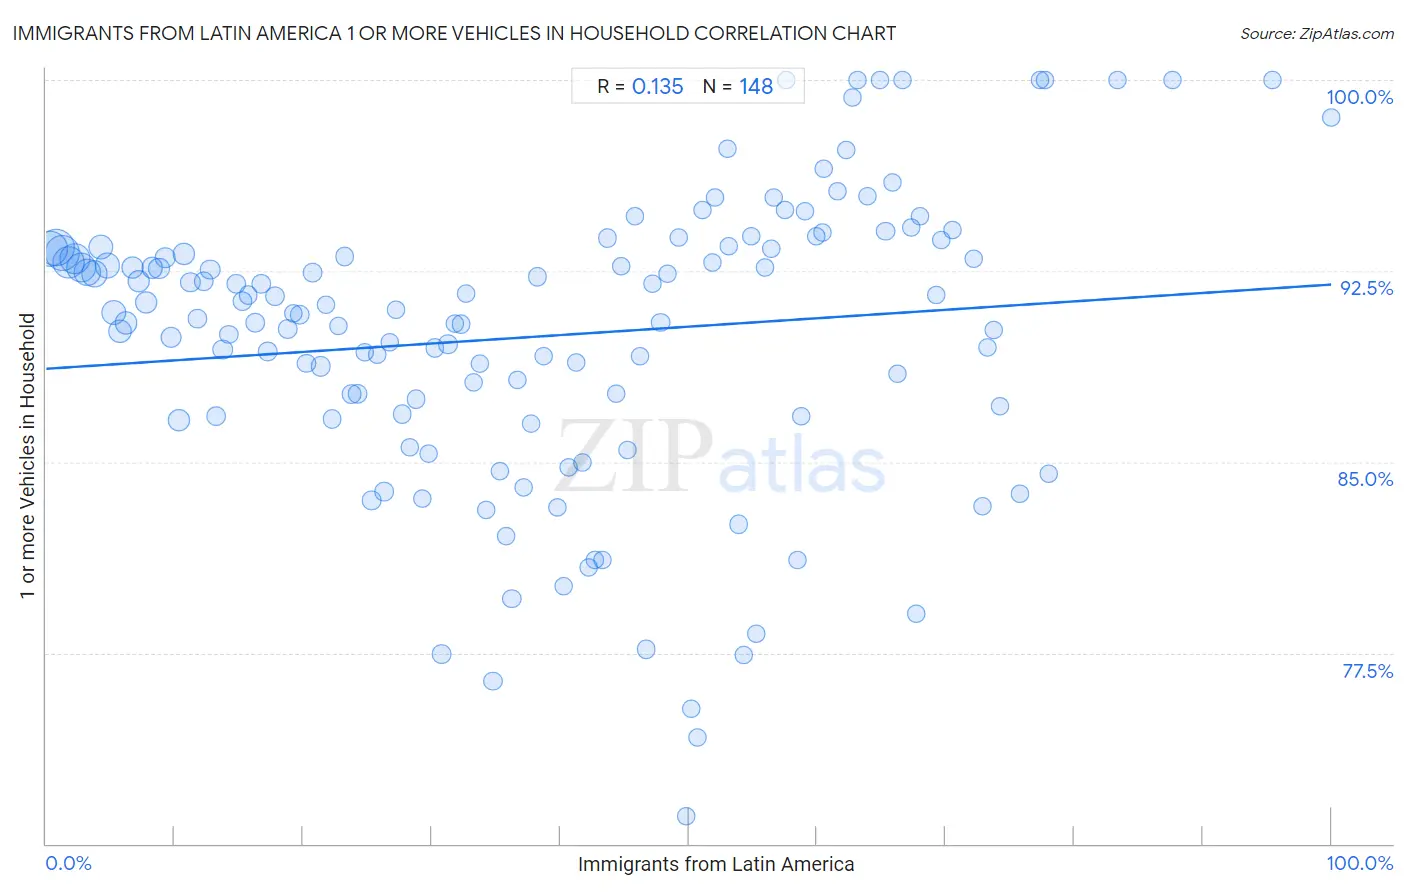
Immigrants from Latin America 1 or more Vehicles in Household Correlation Chart
The statistical analysis conducted on geographies consisting of 546,306,892 people shows a poor positive correlation between the proportion of Immigrants from Latin America and percentage of households with 1 or more vehicles available in the United States with a correlation coefficient (R) of 0.135 and weighted average of 89.8%. On average, for every 1% (one percent) increase in Immigrants from Latin America within a typical geography, there is an increase of 0.033% in percentage of households with 1 or more vehicles available.
It is essential to understand that the correlation between the percentage of Immigrants from Latin America and percentage of households with 1 or more vehicles available does not imply a direct cause-and-effect relationship. It remains uncertain whether the presence of Immigrants from Latin America influences an upward or downward trend in the level of percentage of households with 1 or more vehicles available within an area, or if Immigrants from Latin America simply ended up residing in those areas with higher or lower levels of percentage of households with 1 or more vehicles available due to other factors.
Demographics Similar to Immigrants from Latin America by 1 or more Vehicles in Household
In terms of 1 or more vehicles in household, the demographic groups most similar to Immigrants from Latin America are Immigrants from Cambodia (89.8%, a difference of 0.0%), Native/Alaskan (89.8%, a difference of 0.010%), Immigrants from Middle Africa (89.9%, a difference of 0.030%), Immigrants from Saudi Arabia (89.9%, a difference of 0.040%), and Immigrants from Costa Rica (89.8%, a difference of 0.040%).
| Demographics | Rating | Rank | 1 or more Vehicles in Household |
| Immigrants from Indonesia | 68.8 /100 | #160 | Good 90.0% |
| Salvadorans | 68.7 /100 | #161 | Good 90.0% |
| Spanish American Indians | 67.0 /100 | #162 | Good 89.9% |
| Immigrants from Austria | 65.5 /100 | #163 | Good 89.9% |
| Comanche | 63.4 /100 | #164 | Good 89.9% |
| Immigrants from Saudi Arabia | 62.6 /100 | #165 | Good 89.9% |
| Immigrants from Middle Africa | 62.2 /100 | #166 | Good 89.9% |
| Immigrants from Latin America | 60.3 /100 | #167 | Good 89.8% |
| Immigrants from Cambodia | 60.1 /100 | #168 | Good 89.8% |
| Natives/Alaskans | 59.5 /100 | #169 | Average 89.8% |
| Immigrants from Costa Rica | 57.6 /100 | #170 | Average 89.8% |
| French American Indians | 54.4 /100 | #171 | Average 89.8% |
| Indonesians | 53.0 /100 | #172 | Average 89.7% |
| Lumbee | 52.8 /100 | #173 | Average 89.7% |
| Filipinos | 50.0 /100 | #174 | Average 89.7% |
Immigrants from Latin America 1 or more Vehicles in Household Correlation Summary
| Measurement | Immigrants from Latin America Data | 1 or more Vehicles in Household Data |
| Minimum | 0.27% | 71.1% |
| Maximum | 100.0% | 100.0% |
| Range | 99.7% | 28.9% |
| Mean | 38.6% | 89.9% |
| Median | 37.4% | 90.9% |
| Interquartile 25% (IQ1) | 19.0% | 86.8% |
| Interquartile 75% (IQ3) | 57.0% | 93.4% |
| Interquartile Range (IQR) | 38.0% | 6.5% |
| Standard Deviation (Sample) | 23.4% | 5.8% |
| Standard Deviation (Population) | 23.4% | 5.7% |
Correlation Details
| Immigrants from Latin America Percentile | Sample Size | 1 or more Vehicles in Household |
[ 0.0% - 0.5% ] 0.27% | 45,242,529 | 93.4% |
[ 0.5% - 1.0% ] 0.75% | 48,718,606 | 93.4% |
[ 1.0% - 1.5% ] 1.24% | 43,035,802 | 93.2% |
[ 1.5% - 2.0% ] 1.75% | 36,534,991 | 92.8% |
[ 2.0% - 2.5% ] 2.25% | 32,696,709 | 93.0% |
[ 2.5% - 3.0% ] 2.75% | 29,458,786 | 92.6% |
[ 3.0% - 3.5% ] 3.22% | 23,800,406 | 92.5% |
[ 3.5% - 4.0% ] 3.75% | 22,382,941 | 92.4% |
[ 4.0% - 4.5% ] 4.25% | 18,577,482 | 93.4% |
[ 4.5% - 5.0% ] 4.75% | 16,768,630 | 92.7% |
[ 5.0% - 5.5% ] 5.23% | 16,115,956 | 90.9% |
[ 5.5% - 6.0% ] 5.74% | 13,006,262 | 90.1% |
[ 6.0% - 6.5% ] 6.24% | 10,837,999 | 90.5% |
[ 6.5% - 7.0% ] 6.74% | 9,553,986 | 92.6% |
[ 7.0% - 7.5% ] 7.24% | 10,038,928 | 92.1% |
[ 7.5% - 8.0% ] 7.74% | 10,133,957 | 91.3% |
[ 8.0% - 8.5% ] 8.26% | 8,110,807 | 92.6% |
[ 8.5% - 9.0% ] 8.77% | 8,041,088 | 92.6% |
[ 9.0% - 9.5% ] 9.25% | 5,432,239 | 93.0% |
[ 9.5% - 10.0% ] 9.71% | 7,226,853 | 89.9% |
[ 10.0% - 10.5% ] 10.29% | 8,823,757 | 86.6% |
[ 10.5% - 11.0% ] 10.68% | 8,938,571 | 93.2% |
[ 11.0% - 11.5% ] 11.23% | 4,325,742 | 92.1% |
[ 11.5% - 12.0% ] 11.77% | 3,788,948 | 90.6% |
[ 12.0% - 12.5% ] 12.23% | 3,124,578 | 92.1% |
[ 12.5% - 13.0% ] 12.77% | 5,408,096 | 92.5% |
[ 13.0% - 13.5% ] 13.25% | 3,836,577 | 86.8% |
[ 13.5% - 14.0% ] 13.70% | 5,399,649 | 89.4% |
[ 14.0% - 14.5% ] 14.25% | 2,802,594 | 90.0% |
[ 14.5% - 15.0% ] 14.77% | 3,189,745 | 92.0% |
[ 15.0% - 15.5% ] 15.26% | 3,412,183 | 91.3% |
[ 15.5% - 16.0% ] 15.72% | 2,912,574 | 91.6% |
[ 16.0% - 16.5% ] 16.24% | 2,147,010 | 90.5% |
[ 16.5% - 17.0% ] 16.74% | 2,948,602 | 92.0% |
[ 17.0% - 17.5% ] 17.24% | 2,147,889 | 89.3% |
[ 17.5% - 18.0% ] 17.80% | 3,378,602 | 91.5% |
[ 18.5% - 19.0% ] 18.78% | 2,077,993 | 90.2% |
[ 19.0% - 19.5% ] 19.24% | 2,213,769 | 90.8% |
[ 19.5% - 20.0% ] 19.71% | 4,717,622 | 90.8% |
[ 20.0% - 20.5% ] 20.25% | 2,023,778 | 88.9% |
[ 20.5% - 21.0% ] 20.71% | 2,719,810 | 92.4% |
[ 21.0% - 21.5% ] 21.37% | 5,961,075 | 88.8% |
[ 21.5% - 22.0% ] 21.77% | 1,387,778 | 91.2% |
[ 22.0% - 22.5% ] 22.24% | 2,020,598 | 86.7% |
[ 22.5% - 23.0% ] 22.74% | 1,577,268 | 90.3% |
[ 23.0% - 23.5% ] 23.24% | 1,824,331 | 93.1% |
[ 23.5% - 24.0% ] 23.78% | 1,497,404 | 87.7% |
[ 24.0% - 24.5% ] 24.24% | 2,965,740 | 87.7% |
[ 24.5% - 25.0% ] 24.76% | 1,190,756 | 89.3% |
[ 25.0% - 25.5% ] 25.30% | 1,258,005 | 83.5% |
[ 25.5% - 26.0% ] 25.77% | 1,402,569 | 89.2% |
[ 26.0% - 26.5% ] 26.30% | 1,355,884 | 83.8% |
[ 26.5% - 27.0% ] 26.74% | 1,224,680 | 89.7% |
[ 27.0% - 27.5% ] 27.25% | 1,203,445 | 91.0% |
[ 27.5% - 28.0% ] 27.73% | 1,388,278 | 86.9% |
[ 28.0% - 28.5% ] 28.29% | 1,053,821 | 85.6% |
[ 28.5% - 29.0% ] 28.79% | 966,925 | 87.5% |
[ 29.0% - 29.5% ] 29.27% | 836,200 | 83.5% |
[ 29.5% - 30.0% ] 29.74% | 778,401 | 85.3% |
[ 30.0% - 30.5% ] 30.25% | 875,325 | 89.5% |
[ 30.5% - 31.0% ] 30.76% | 1,336,820 | 77.5% |
[ 31.0% - 31.5% ] 31.26% | 835,467 | 89.6% |
[ 31.5% - 32.0% ] 31.78% | 763,844 | 90.4% |
[ 32.0% - 32.5% ] 32.30% | 1,090,367 | 90.4% |
[ 32.5% - 33.0% ] 32.70% | 858,313 | 91.6% |
[ 33.0% - 33.5% ] 33.25% | 673,541 | 88.1% |
[ 33.5% - 34.0% ] 33.75% | 626,208 | 88.9% |
[ 34.0% - 34.5% ] 34.19% | 358,518 | 83.1% |
[ 34.5% - 35.0% ] 34.77% | 712,352 | 76.4% |
[ 35.0% - 35.5% ] 35.30% | 503,144 | 84.7% |
[ 35.5% - 36.0% ] 35.81% | 727,398 | 82.1% |
[ 36.0% - 36.5% ] 36.23% | 319,984 | 79.6% |
[ 36.5% - 37.0% ] 36.71% | 449,536 | 88.2% |
[ 37.0% - 37.5% ] 37.13% | 505,313 | 84.0% |
[ 37.5% - 38.0% ] 37.70% | 694,639 | 86.5% |
[ 38.0% - 38.5% ] 38.21% | 507,097 | 92.3% |
[ 38.5% - 39.0% ] 38.69% | 510,042 | 89.1% |
[ 39.5% - 40.0% ] 39.77% | 409,826 | 83.2% |
[ 40.0% - 40.5% ] 40.27% | 522,560 | 80.1% |
[ 40.5% - 41.0% ] 40.67% | 737,522 | 84.8% |
[ 41.0% - 41.5% ] 41.22% | 181,420 | 88.9% |
[ 41.5% - 42.0% ] 41.73% | 166,930 | 85.0% |
[ 42.0% - 42.5% ] 42.24% | 434,835 | 80.8% |
[ 42.5% - 43.0% ] 42.73% | 420,580 | 81.1% |
[ 43.0% - 43.5% ] 43.31% | 238,058 | 81.2% |
[ 43.5% - 44.0% ] 43.69% | 207,488 | 93.8% |
[ 44.0% - 44.5% ] 44.34% | 328,210 | 87.7% |
[ 44.5% - 45.0% ] 44.72% | 288,811 | 92.7% |
[ 45.0% - 45.5% ] 45.24% | 127,862 | 85.5% |
[ 45.5% - 46.0% ] 45.85% | 173,696 | 94.6% |
[ 46.0% - 46.5% ] 46.17% | 107,212 | 89.1% |
[ 46.5% - 47.0% ] 46.72% | 226,937 | 77.6% |
[ 47.0% - 47.5% ] 47.16% | 201,624 | 92.0% |
[ 47.5% - 48.0% ] 47.81% | 157,334 | 90.5% |
[ 48.0% - 48.5% ] 48.38% | 48,779 | 92.4% |
[ 49.0% - 49.5% ] 49.22% | 96,782 | 93.8% |
[ 49.5% - 50.0% ] 49.81% | 249,542 | 71.1% |
[ 50.0% - 50.5% ] 50.15% | 86,921 | 75.3% |
[ 50.5% - 51.0% ] 50.72% | 111,589 | 74.2% |
[ 51.0% - 51.5% ] 51.11% | 21,106 | 94.9% |
[ 51.5% - 52.0% ] 51.81% | 133,698 | 92.8% |
[ 52.0% - 52.5% ] 52.07% | 45,589 | 95.4% |
[ 52.5% - 53.0% ] 52.98% | 13,877 | 97.3% |
[ 53.0% - 53.5% ] 53.10% | 55,370 | 93.5% |
[ 53.5% - 54.0% ] 53.89% | 443,715 | 82.5% |
[ 54.0% - 54.5% ] 54.26% | 35,373 | 77.4% |
[ 54.5% - 55.0% ] 54.90% | 38,109 | 93.9% |
[ 55.0% - 55.5% ] 55.24% | 13,854 | 78.2% |
[ 55.5% - 56.0% ] 55.93% | 55,613 | 92.6% |
[ 56.0% - 56.5% ] 56.38% | 16,542 | 93.4% |
[ 56.5% - 57.0% ] 56.59% | 68,833 | 95.4% |
[ 57.0% - 57.5% ] 57.49% | 7,181 | 94.9% |
[ 57.5% - 58.0% ] 57.58% | 1,023 | 100.0% |
[ 58.0% - 58.5% ] 58.48% | 26,073 | 81.1% |
[ 58.5% - 59.0% ] 58.77% | 7,764 | 86.8% |
[ 59.0% - 59.5% ] 59.08% | 51,120 | 94.9% |
[ 59.5% - 60.0% ] 59.91% | 95,914 | 93.9% |
[ 60.0% - 60.5% ] 60.44% | 25,128 | 94.0% |
[ 60.5% - 61.0% ] 60.52% | 83,972 | 96.5% |
[ 61.5% - 62.0% ] 61.54% | 11,408 | 95.6% |
[ 62.0% - 62.5% ] 62.24% | 108,249 | 97.2% |
[ 62.5% - 63.0% ] 62.73% | 14,911 | 99.3% |
[ 63.0% - 63.5% ] 63.13% | 358 | 100.0% |
[ 63.5% - 64.0% ] 63.90% | 167,279 | 95.4% |
[ 64.5% - 65.0% ] 64.85% | 1,101 | 100.0% |
[ 65.0% - 65.5% ] 65.32% | 109,226 | 94.1% |
[ 65.5% - 66.0% ] 65.81% | 52,851 | 96.0% |
[ 66.0% - 66.5% ] 66.26% | 44,768 | 88.5% |
[ 66.5% - 67.0% ] 66.67% | 114 | 100.0% |
[ 67.0% - 67.5% ] 67.28% | 40,406 | 94.2% |
[ 67.5% - 68.0% ] 67.74% | 54,873 | 79.0% |
[ 68.0% - 68.5% ] 68.02% | 20,850 | 94.6% |
[ 69.0% - 69.5% ] 69.27% | 26,635 | 91.6% |
[ 69.5% - 70.0% ] 69.67% | 57,066 | 93.7% |
[ 70.5% - 71.0% ] 70.54% | 68,575 | 94.1% |
[ 72.0% - 72.5% ] 72.21% | 19,688 | 93.0% |
[ 72.5% - 73.0% ] 72.82% | 64,572 | 83.3% |
[ 73.0% - 73.5% ] 73.24% | 222,996 | 89.5% |
[ 73.5% - 74.0% ] 73.72% | 46,851 | 90.2% |
[ 74.0% - 74.5% ] 74.26% | 71,119 | 87.2% |
[ 75.5% - 76.0% ] 75.74% | 1,018 | 83.7% |
[ 77.0% - 77.5% ] 77.38% | 84 | 100.0% |
[ 77.5% - 78.0% ] 77.68% | 112 | 100.0% |
[ 78.0% - 78.5% ] 78.01% | 42,081 | 84.5% |
[ 83.0% - 83.5% ] 83.33% | 72 | 100.0% |
[ 87.5% - 88.0% ] 87.63% | 97 | 100.0% |
[ 95.0% - 95.5% ] 95.43% | 197 | 100.0% |
[ 99.5% - 100.0% ] 100.00% | 851 | 98.5% |