Immigrants from South Eastern Asia 1 or more Vehicles in Household
COMPARE
Immigrants from South Eastern Asia
Select to Compare
1 or more Vehicles in Household
Immigrants from South Eastern Asia 1 or more Vehicles in Household
91.4%
1+ VEHICLES AVAILABLE
99.3/ 100
METRIC RATING
81st/ 347
METRIC RANK
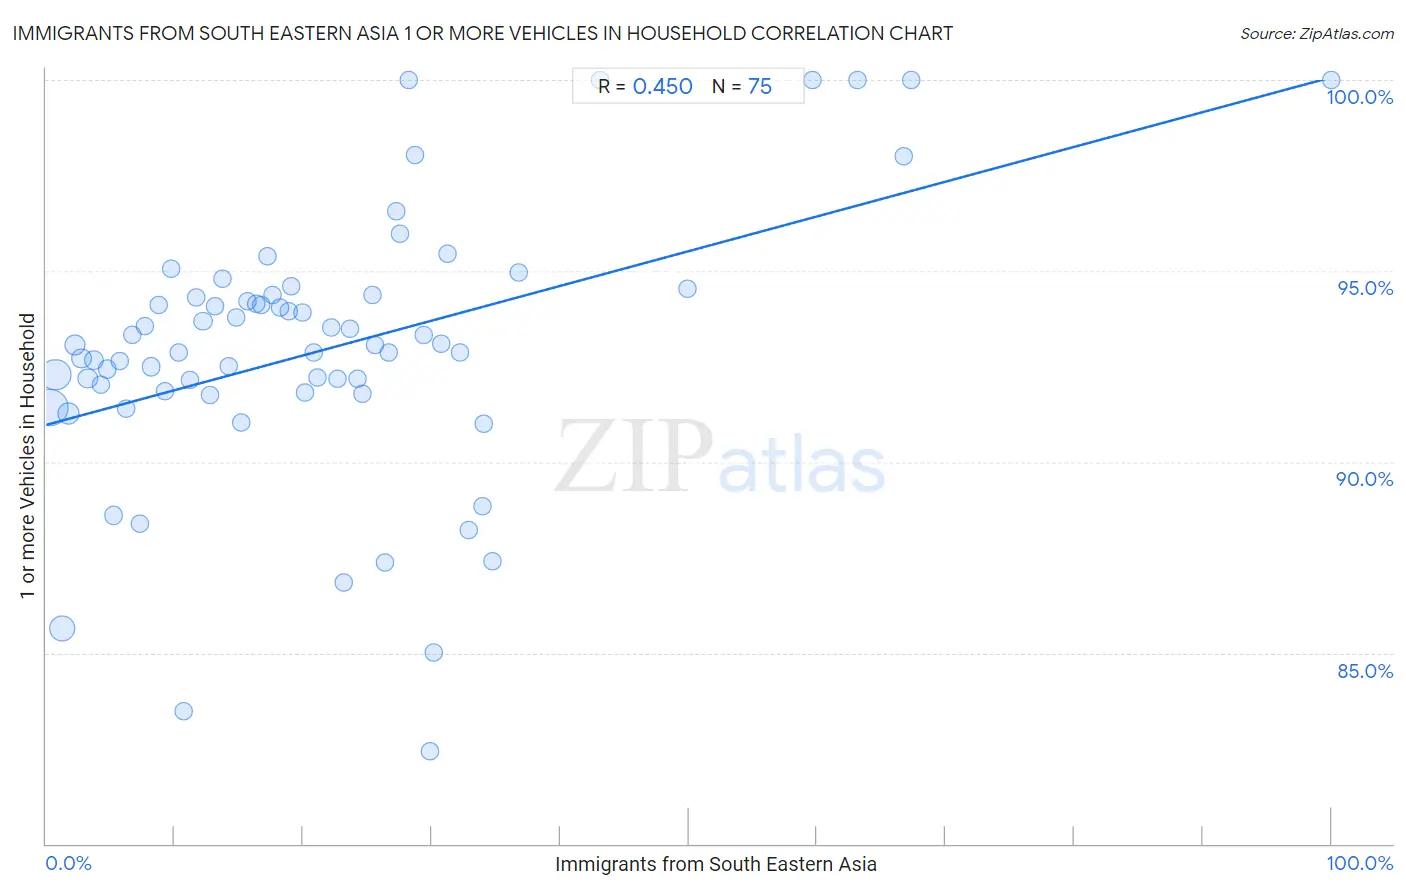
Immigrants from South Eastern Asia 1 or more Vehicles in Household Correlation Chart
The statistical analysis conducted on geographies consisting of 512,318,817 people shows a moderate positive correlation between the proportion of Immigrants from South Eastern Asia and percentage of households with 1 or more vehicles available in the United States with a correlation coefficient (R) of 0.450 and weighted average of 91.4%. On average, for every 1% (one percent) increase in Immigrants from South Eastern Asia within a typical geography, there is an increase of 0.091% in percentage of households with 1 or more vehicles available.
It is essential to understand that the correlation between the percentage of Immigrants from South Eastern Asia and percentage of households with 1 or more vehicles available does not imply a direct cause-and-effect relationship. It remains uncertain whether the presence of Immigrants from South Eastern Asia influences an upward or downward trend in the level of percentage of households with 1 or more vehicles available within an area, or if Immigrants from South Eastern Asia simply ended up residing in those areas with higher or lower levels of percentage of households with 1 or more vehicles available due to other factors.
Demographics Similar to Immigrants from South Eastern Asia by 1 or more Vehicles in Household
In terms of 1 or more vehicles in household, the demographic groups most similar to Immigrants from South Eastern Asia are Lebanese (91.4%, a difference of 0.010%), Immigrants from England (91.4%, a difference of 0.010%), Jordanian (91.4%, a difference of 0.020%), Bolivian (91.5%, a difference of 0.030%), and Tsimshian (91.4%, a difference of 0.030%).
| Demographics | Rating | Rank | 1 or more Vehicles in Household |
| Immigrants from Lebanon | 99.6 /100 | #74 | Exceptional 91.6% |
| Portuguese | 99.5 /100 | #75 | Exceptional 91.6% |
| Cubans | 99.5 /100 | #76 | Exceptional 91.5% |
| Immigrants from Philippines | 99.4 /100 | #77 | Exceptional 91.5% |
| Iranians | 99.4 /100 | #78 | Exceptional 91.5% |
| Immigrants from South Central Asia | 99.4 /100 | #79 | Exceptional 91.5% |
| Bolivians | 99.4 /100 | #80 | Exceptional 91.5% |
| Immigrants from South Eastern Asia | 99.3 /100 | #81 | Exceptional 91.4% |
| Lebanese | 99.3 /100 | #82 | Exceptional 91.4% |
| Immigrants from England | 99.3 /100 | #83 | Exceptional 91.4% |
| Jordanians | 99.3 /100 | #84 | Exceptional 91.4% |
| Tsimshian | 99.3 /100 | #85 | Exceptional 91.4% |
| Osage | 99.2 /100 | #86 | Exceptional 91.4% |
| Immigrants from Germany | 99.2 /100 | #87 | Exceptional 91.4% |
| Spanish Americans | 99.2 /100 | #88 | Exceptional 91.4% |
Immigrants from South Eastern Asia 1 or more Vehicles in Household Correlation Summary
| Measurement | Immigrants from South Eastern Asia Data | 1 or more Vehicles in Household Data |
| Minimum | 0.25% | 82.4% |
| Maximum | 100.0% | 100.0% |
| Range | 99.8% | 17.6% |
| Mean | 21.6% | 92.9% |
| Median | 18.9% | 93.1% |
| Interquartile 25% (IQ1) | 9.2% | 91.8% |
| Interquartile 75% (IQ3) | 28.7% | 94.4% |
| Interquartile Range (IQR) | 19.5% | 2.5% |
| Standard Deviation (Sample) | 17.6% | 3.6% |
| Standard Deviation (Population) | 17.5% | 3.5% |
Correlation Details
| Immigrants from South Eastern Asia Percentile | Sample Size | 1 or more Vehicles in Household |
[ 0.0% - 0.5% ] 0.25% | 171,274,989 | 91.4% |
[ 0.5% - 1.0% ] 0.73% | 118,679,828 | 92.3% |
[ 1.0% - 1.5% ] 1.23% | 74,059,891 | 85.6% |
[ 1.5% - 2.0% ] 1.73% | 39,094,120 | 91.3% |
[ 2.0% - 2.5% ] 2.22% | 23,543,905 | 93.1% |
[ 2.5% - 3.0% ] 2.75% | 17,155,952 | 92.7% |
[ 3.0% - 3.5% ] 3.24% | 17,014,114 | 92.2% |
[ 3.5% - 4.0% ] 3.74% | 8,421,911 | 92.7% |
[ 4.0% - 4.5% ] 4.25% | 6,841,043 | 92.0% |
[ 4.5% - 5.0% ] 4.73% | 5,116,829 | 92.4% |
[ 5.0% - 5.5% ] 5.23% | 4,133,244 | 88.6% |
[ 5.5% - 6.0% ] 5.75% | 4,629,365 | 92.6% |
[ 6.0% - 6.5% ] 6.26% | 1,948,706 | 91.4% |
[ 6.5% - 7.0% ] 6.72% | 3,118,475 | 93.3% |
[ 7.0% - 7.5% ] 7.25% | 1,597,197 | 88.4% |
[ 7.5% - 8.0% ] 7.70% | 2,460,723 | 93.5% |
[ 8.0% - 8.5% ] 8.20% | 1,548,529 | 92.5% |
[ 8.5% - 9.0% ] 8.75% | 734,319 | 94.1% |
[ 9.0% - 9.5% ] 9.22% | 1,073,752 | 91.9% |
[ 9.5% - 10.0% ] 9.72% | 1,331,648 | 95.1% |
[ 10.0% - 10.5% ] 10.30% | 483,883 | 92.9% |
[ 10.5% - 11.0% ] 10.70% | 1,129,216 | 83.5% |
[ 11.0% - 11.5% ] 11.19% | 682,812 | 92.2% |
[ 11.5% - 12.0% ] 11.68% | 466,497 | 94.3% |
[ 12.0% - 12.5% ] 12.21% | 1,339,327 | 93.7% |
[ 12.5% - 13.0% ] 12.71% | 391,469 | 91.8% |
[ 13.0% - 13.5% ] 13.14% | 170,053 | 94.1% |
[ 13.5% - 14.0% ] 13.74% | 419,626 | 94.8% |
[ 14.0% - 14.5% ] 14.24% | 54,501 | 92.5% |
[ 14.5% - 15.0% ] 14.82% | 368,379 | 93.8% |
[ 15.0% - 15.5% ] 15.19% | 297,025 | 91.0% |
[ 15.5% - 16.0% ] 15.67% | 69,178 | 94.2% |
[ 16.0% - 16.5% ] 16.36% | 381,650 | 94.1% |
[ 16.5% - 17.0% ] 16.75% | 343,907 | 94.1% |
[ 17.0% - 17.5% ] 17.20% | 73,046 | 95.4% |
[ 17.5% - 18.0% ] 17.57% | 40,056 | 94.4% |
[ 18.0% - 18.5% ] 18.19% | 1,127 | 94.1% |
[ 18.5% - 19.0% ] 18.91% | 101,316 | 93.9% |
[ 19.0% - 19.5% ] 19.06% | 81,330 | 94.6% |
[ 19.5% - 20.0% ] 19.90% | 14,597 | 93.9% |
[ 20.0% - 20.5% ] 20.18% | 3,003 | 91.8% |
[ 20.5% - 21.0% ] 20.83% | 115,224 | 92.9% |
[ 21.0% - 21.5% ] 21.10% | 84,817 | 92.2% |
[ 22.0% - 22.5% ] 22.20% | 140,870 | 93.5% |
[ 22.5% - 23.0% ] 22.65% | 106,065 | 92.2% |
[ 23.0% - 23.5% ] 23.16% | 3,800 | 86.8% |
[ 23.5% - 24.0% ] 23.62% | 110,453 | 93.5% |
[ 24.0% - 24.5% ] 24.26% | 164,096 | 92.2% |
[ 24.5% - 25.0% ] 24.61% | 65,345 | 91.8% |
[ 25.0% - 25.5% ] 25.36% | 213,963 | 94.4% |
[ 25.5% - 26.0% ] 25.62% | 25,902 | 93.1% |
[ 26.0% - 26.5% ] 26.34% | 52,974 | 87.4% |
[ 26.5% - 27.0% ] 26.65% | 72,605 | 92.8% |
[ 27.0% - 27.5% ] 27.24% | 16,457 | 96.6% |
[ 27.5% - 28.0% ] 27.55% | 49,074 | 96.0% |
[ 28.0% - 28.5% ] 28.18% | 401 | 100.0% |
[ 28.5% - 29.0% ] 28.71% | 996 | 98.0% |
[ 29.0% - 29.5% ] 29.40% | 40,993 | 93.3% |
[ 29.5% - 30.0% ] 29.88% | 17,533 | 82.4% |
[ 30.0% - 30.5% ] 30.16% | 63 | 85.0% |
[ 30.5% - 31.0% ] 30.72% | 47,549 | 93.1% |
[ 31.0% - 31.5% ] 31.24% | 36,657 | 95.4% |
[ 32.0% - 32.5% ] 32.23% | 181,268 | 92.9% |
[ 32.5% - 33.0% ] 32.90% | 921 | 88.2% |
[ 33.5% - 34.0% ] 33.96% | 9,160 | 88.8% |
[ 34.0% - 34.5% ] 34.06% | 22,622 | 91.0% |
[ 34.5% - 35.0% ] 34.76% | 39,873 | 87.4% |
[ 36.5% - 37.0% ] 36.78% | 4,342 | 95.0% |
[ 43.0% - 43.5% ] 43.10% | 116 | 100.0% |
[ 49.5% - 50.0% ] 49.87% | 766 | 94.5% |
[ 59.5% - 60.0% ] 59.64% | 223 | 100.0% |
[ 63.0% - 63.5% ] 63.10% | 84 | 100.0% |
[ 66.5% - 67.0% ] 66.69% | 2,996 | 98.0% |
[ 67.0% - 67.5% ] 67.35% | 49 | 100.0% |
[ 99.5% - 100.0% ] 100.00% | 22 | 100.0% |