Fijian 1 or more Vehicles in Household

COMPARE

Fijian
Race
Ancestry
AfghanAfricanAlaska NativeAlaskan AthabascanAlbanianAleutAlsatianAmericanApacheArabArapahoArgentineanArmenianAssyrian/Chaldean/SyriacAustralianAustrianBahamianBangladeshiBarbadianBasqueBelgianBelizeanBermudanBhutaneseBlackfeetBolivianBrazilianBritishBritish West IndianBulgarianBurmeseCajunCambodianCanadianCape VerdeanCarpatho RusynCelticCentral AmericanCentral American IndianCherokeeCheyenneChickasawChileanChineseChippewaChoctawColombianColvilleComancheCosta RicanCreeCreekCroatianCrowCubanCypriotCzechCzechoslovakianDanishDelawareDominicanDutchDutch West IndianEastern EuropeanEcuadorianEgyptianEnglishEstonianEthiopianEuropeanFijianFilipinoFinnishFrenchFrench American IndianFrench CanadianGermanGerman RussianGhanaianGreekGuamanian/ChamorroGuatemalanGuyaneseHaitianHmongHonduranHopiHoumaHungarianIcelanderIndian (Asian)IndonesianInupiatIranianIraqiIrishIroquoisIsraeliItalianJamaicanJapaneseJordanianKenyanKiowaKoreanLaotianLatvianLebaneseLiberianLithuanianLumbeeLuxembourgerMacedonianMalaysianMalteseMarshalleseMenomineeMexicanMexican American IndianMongolianMoroccanNative HawaiianNavajoNepaleseNew ZealanderNicaraguanNigerianNorthern EuropeanNorwegianOkinawanOsageOttawaPaiutePakistaniPalestinianPanamanianParaguayanPennsylvania GermanPeruvianPimaPolishPortuguesePotawatomiPuebloPuerto RicanPuget Sound SalishRomanianRussianSalvadoranSamoanScandinavianScotch-IrishScottishSeminoleSenegaleseSerbianShoshoneSierra LeoneanSiouxSlavicSlovakSloveneSomaliSouth AfricanSouth AmericanSouth American IndianSoviet UnionSpaniardSpanishSpanish AmericanSpanish American IndianSri LankanSubsaharan AfricanSudaneseSwedishSwissSyrianTaiwaneseThaiTlingit-HaidaTohono O'OdhamTonganTrinidadian and TobagonianTsimshianTurkishU.S. Virgin IslanderUgandanUkrainianUruguayanUteVenezuelanVietnameseWelshWest IndianYakamaYaquiYugoslavianYumanYup'ikZimbabwean
Immigration
NonimmigrantsImmigrantsAfghanistanAfricaAlbaniaArgentinaArmeniaAsiaAustraliaAustriaBahamasBangladeshBarbadosBelarusBelgiumBelizeBoliviaBosnia and HerzegovinaBrazilBulgariaBurma/MyanmarCabo VerdeCambodiaCameroonCanadaCaribbeanCentral AmericaChileChinaColombiaCongoCosta RicaCroatiaCubaCzechoslovakiaDenmarkDominicaDominican RepublicEastern AfricaEastern AsiaEastern EuropeEcuadorEgyptEl SalvadorEnglandEritreaEthiopiaEuropeFijiFranceGermanyGhanaGreeceGrenadaGuatemalaGuyanaHaitiHondurasHong KongHungaryIndiaIndonesiaIranIraqIrelandIsraelItalyJamaicaJapanJordanKazakhstanKenyaKoreaKuwaitLaosLatin AmericaLatviaLebanonLiberiaLithuaniaMalaysiaMexicoMicronesiaMiddle AfricaMoldovaMoroccoNepalNetherlandsNicaraguaNigeriaNorth AmericaNorth MacedoniaNorthern AfricaNorthern EuropeNorwayOceaniaPakistanPanamaPeruPhilippinesPolandPortugalRomaniaRussiaSaudi ArabiaScotlandSenegalSerbiaSierra LeoneSingaporeSomaliaSouth AfricaSouth AmericaSouth Central AsiaSouth Eastern AsiaSouthern EuropeSpainSri LankaSt. Vincent and the GrenadinesSudanSwedenSwitzerlandSyriaTaiwanThailandTrinidad and TobagoTurkeyUgandaUkraineUruguayUzbekistanVenezuelaVietnamWest IndiesWestern AfricaWestern AsiaWestern EuropeYemenZaireZimbabweAzores
Select to Compare
Race
Ancestry
AfghanAfricanAlaska NativeAlaskan AthabascanAlbanianAleutAlsatianAmericanApacheArabArapahoArgentineanArmenianAssyrian/Chaldean/SyriacAustralianAustrianBahamianBangladeshiBarbadianBasqueBelgianBelizeanBermudanBhutaneseBlackfeetBolivianBrazilianBritishBritish West IndianBulgarianBurmeseCajunCambodianCanadianCape VerdeanCarpatho RusynCelticCentral AmericanCentral American IndianCherokeeCheyenneChickasawChileanChineseChippewaChoctawColombianColvilleComancheCosta RicanCreeCreekCroatianCrowCubanCypriotCzechCzechoslovakianDanishDelawareDominicanDutchDutch West IndianEastern EuropeanEcuadorianEgyptianEnglishEstonianEthiopianEuropeanFilipinoFinnishFrenchFrench American IndianFrench CanadianGermanGerman RussianGhanaianGreekGuamanian/ChamorroGuatemalanGuyaneseHaitianHmongHonduranHopiHoumaHungarianIcelanderIndian (Asian)IndonesianInupiatIranianIraqiIrishIroquoisIsraeliItalianJamaicanJapaneseJordanianKenyanKiowaKoreanLaotianLatvianLebaneseLiberianLithuanianLumbeeLuxembourgerMacedonianMalaysianMalteseMarshalleseMenomineeMexicanMexican American IndianMongolianMoroccanNative HawaiianNavajoNepaleseNew ZealanderNicaraguanNigerianNorthern EuropeanNorwegianOkinawanOsageOttawaPaiutePakistaniPalestinianPanamanianParaguayanPennsylvania GermanPeruvianPimaPolishPortuguesePotawatomiPuebloPuerto RicanPuget Sound SalishRomanianRussianSalvadoranSamoanScandinavianScotch-IrishScottishSeminoleSenegaleseSerbianShoshoneSierra LeoneanSiouxSlavicSlovakSloveneSomaliSouth AfricanSouth AmericanSouth American IndianSoviet UnionSpaniardSpanishSpanish AmericanSpanish American IndianSri LankanSubsaharan AfricanSudaneseSwedishSwissSyrianTaiwaneseThaiTlingit-HaidaTohono O'OdhamTonganTrinidadian and TobagonianTsimshianTurkishU.S. Virgin IslanderUgandanUkrainianUruguayanUteVenezuelanVietnameseWelshWest IndianYakamaYaquiYugoslavianYumanYup'ikZimbabwean
Immigration
NonimmigrantsImmigrantsAfghanistanAfricaAlbaniaArgentinaArmeniaAsiaAustraliaAustriaBahamasBangladeshBarbadosBelarusBelgiumBelizeBoliviaBosnia and HerzegovinaBrazilBulgariaBurma/MyanmarCabo VerdeCambodiaCameroonCanadaCaribbeanCentral AmericaChileChinaColombiaCongoCosta RicaCroatiaCubaCzechoslovakiaDenmarkDominicaDominican RepublicEastern AfricaEastern AsiaEastern EuropeEcuadorEgyptEl SalvadorEnglandEritreaEthiopiaEuropeFijiFranceGermanyGhanaGreeceGrenadaGuatemalaGuyanaHaitiHondurasHong KongHungaryIndiaIndonesiaIranIraqIrelandIsraelItalyJamaicaJapanJordanKazakhstanKenyaKoreaKuwaitLaosLatin AmericaLatviaLebanonLiberiaLithuaniaMalaysiaMexicoMicronesiaMiddle AfricaMoldovaMoroccoNepalNetherlandsNicaraguaNigeriaNorth AmericaNorth MacedoniaNorthern AfricaNorthern EuropeNorwayOceaniaPakistanPanamaPeruPhilippinesPolandPortugalRomaniaRussiaSaudi ArabiaScotlandSenegalSerbiaSierra LeoneSingaporeSomaliaSouth AfricaSouth AmericaSouth Central AsiaSouth Eastern AsiaSouthern EuropeSpainSri LankaSt. Vincent and the GrenadinesSudanSwedenSwitzerlandSyriaTaiwanThailandTrinidad and TobagoTurkeyUgandaUkraineUruguayUzbekistanVenezuelaVietnamWest IndiesWestern AfricaWestern AsiaWestern EuropeYemenZaireZimbabweAzores
1 or more Vehicles in Household
Income
Poverty
Unemployment
Labor Participation
Family Structure
Vehicle Availability
Education Level
Disability

Fijian 1 or more Vehicles in Household
Exceptional

90.5%
1+ VEHICLES AVAILABLE
91.8/ 100
METRIC RATING
123rd/ 347
METRIC RANK

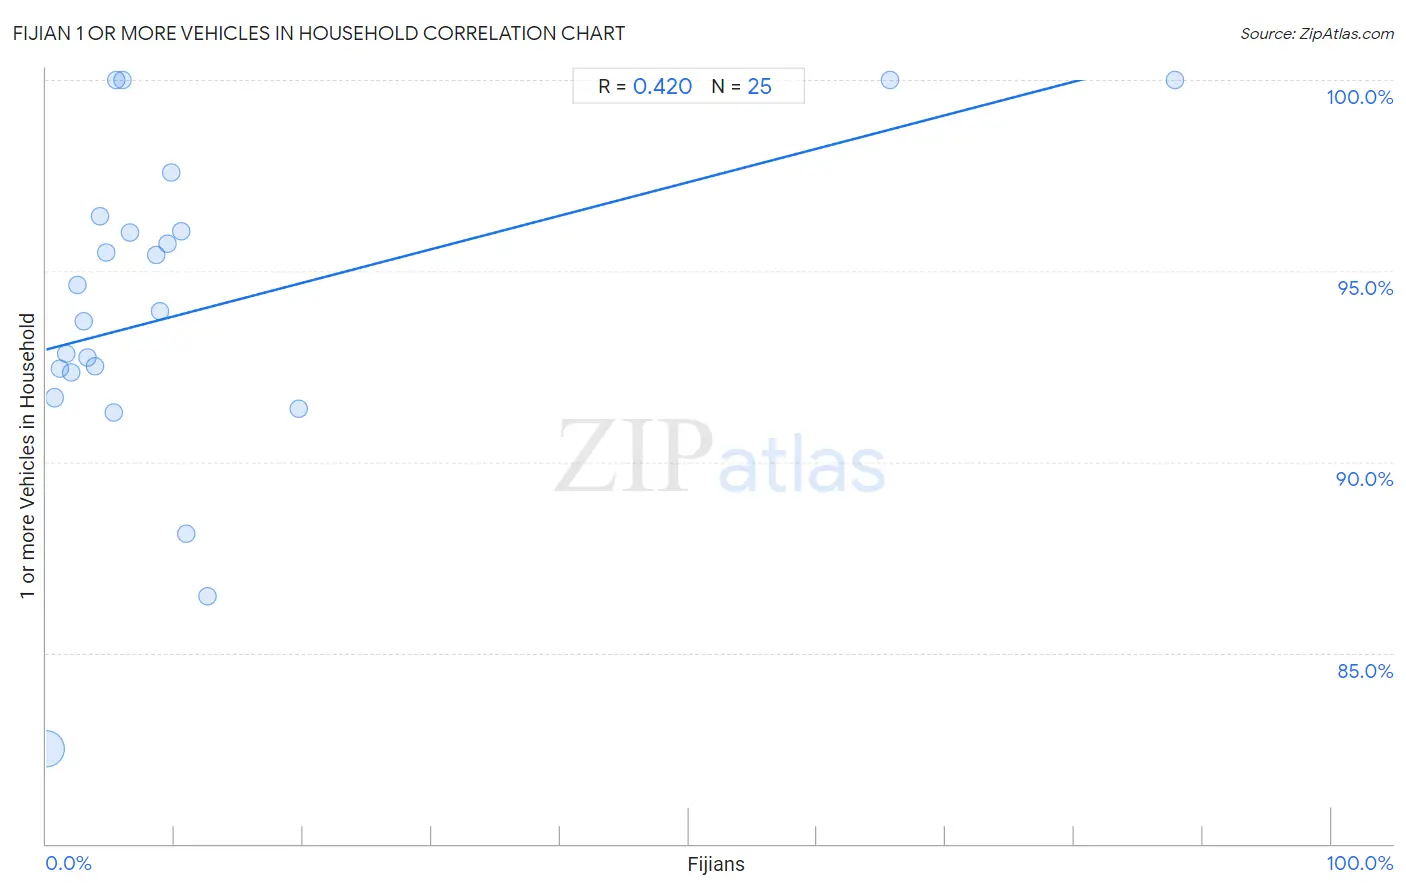
Fijian 1 or more Vehicles in Household Correlation Chart

The statistical analysis conducted on geographies consisting of 55,948,040 people shows a moderate positive correlation between the proportion of Fijians and percentage of households with 1 or more vehicles available in the United States with a correlation coefficient (R) of 0.420 and weighted average of 90.5%. On average, for every 1% (one percent) increase in Fijians within a typical geography, there is an increase of 0.088% in percentage of households with 1 or more vehicles available.
Fijian 1 or more Vehicles in Household
It is essential to understand that the correlation between the percentage of Fijians and percentage of households with 1 or more vehicles available does not imply a direct cause-and-effect relationship. It remains uncertain whether the presence of Fijians influences an upward or downward trend in the level of percentage of households with 1 or more vehicles available within an area, or if Fijians simply ended up residing in those areas with higher or lower levels of percentage of households with 1 or more vehicles available due to other factors.

Demographics Similar to Fijians by 1 or more Vehicles in Household

In terms of 1 or more vehicles in household, the demographic groups most similar to Fijians are Icelander (90.5%, a difference of 0.010%), Costa Rican (90.5%, a difference of 0.010%), Immigrants from Thailand (90.6%, a difference of 0.020%), Puget Sound Salish (90.5%, a difference of 0.020%), and Blackfeet (90.6%, a difference of 0.040%).
DemographicsRating | Rank1 or more Vehicles in Household
Chippewa
94.3
/100
|
#116
Exceptional
90.7%
Greeks
93.5
/100
|
#117
Exceptional
90.6%
Japanese
93.4
/100
|
#118
Exceptional
90.6%
Blackfeet
92.6
/100
|
#119
Exceptional
90.6%
Immigrants from Thailand
92.3
/100
|
#120
Exceptional
90.6%
Icelanders
92.1
/100
|
#121
Exceptional
90.5%
Costa Ricans
92.0
/100
|
#122
Exceptional
90.5%
Fijians
91.8
/100
|
#123
Exceptional
90.5%
Puget Sound Salish
91.5
/100
|
#124
Exceptional
90.5%
Immigrants from Korea
90.5
/100
|
#125
Exceptional
90.5%
Immigrants from Cameroon
89.4
/100
|
#126
Excellent
90.4%
Immigrants from the Azores
89.1
/100
|
#127
Excellent
90.4%
Burmese
89.0
/100
|
#128
Excellent
90.4%
Marshallese
88.9
/100
|
#129
Excellent
90.4%
Nicaraguans
88.8
/100
|
#130
Excellent
90.4%

Fijian 1 or more Vehicles in Household Correlation Summary

MeasurementFijian Data1 or more Vehicles in Household Data
Minimum0.040%82.5%
Maximum87.8%100.0%
Range87.8%17.5%
Mean11.7%94.0%
Median5.4%93.9%
Interquartile 25% (IQ1)2.7%92.0%
Interquartile 75% (IQ3)10.1%96.2%
Interquartile Range (IQR)7.4%4.2%
Standard Deviation (Sample)20.3%4.2%
Standard Deviation (Population)19.9%4.2%

Correlation Details

Fijian PercentileSample Size1 or more Vehicles in Household
[
0.0%
-
0.5%
]
0.040%
51,731,88782.5%
[
0.5%
-
1.0%
]
0.63%
2,360,94891.7%
[
1.0%
-
1.5%
]
1.07%
683,44492.4%
[
1.5%
-
2.0%
]
1.55%
350,10892.8%
[
1.5%
-
2.0%
]
1.98%
236,43492.3%
[
2.0%
-
2.5%
]
2.39%
95,43594.6%
[
2.5%
-
3.0%
]
2.92%
153,09593.7%
[
3.0%
-
3.5%
]
3.20%
46,13692.7%
[
3.5%
-
4.0%
]
3.81%
13,40692.5%
[
4.0%
-
4.5%
]
4.18%
38,85696.4%
[
4.5%
-
5.0%
]
4.65%
52,78195.5%
[
5.0%
-
5.5%
]
5.23%
4,22291.3%
[
5.0%
-
5.5%
]
5.43%
774100.0%
[
5.5%
-
6.0%
]
5.94%
101100.0%
[
6.5%
-
7.0%
]
6.55%
86,70596.0%
[
8.5%
-
9.0%
]
8.57%
58,06695.4%
[
8.5%
-
9.0%
]
8.84%
25,89293.9%
[
9.0%
-
9.5%
]
9.40%
4,62895.7%
[
9.5%
-
10.0%
]
9.73%
40197.6%
[
10.0%
-
10.5%
]
10.46%
1,21496.0%
[
10.5%
-
11.0%
]
10.93%
1,67488.1%
[
12.5%
-
13.0%
]
12.52%
1,46286.5%
[
19.5%
-
20.0%
]
19.70%
19891.4%
[
65.5%
-
66.0%
]
65.66%
99100.0%
[
87.5%
-
88.0%
]
87.84%
74100.0%