Subsaharan African Single Father Households
COMPARE
Subsaharan African
Select to Compare
Single Father Households
Subsaharan African Single Father Households
2.4%
SINGLE FATHER HOUSEHOLDS
8.3/ 100
METRIC RATING
230th/ 347
METRIC RANK
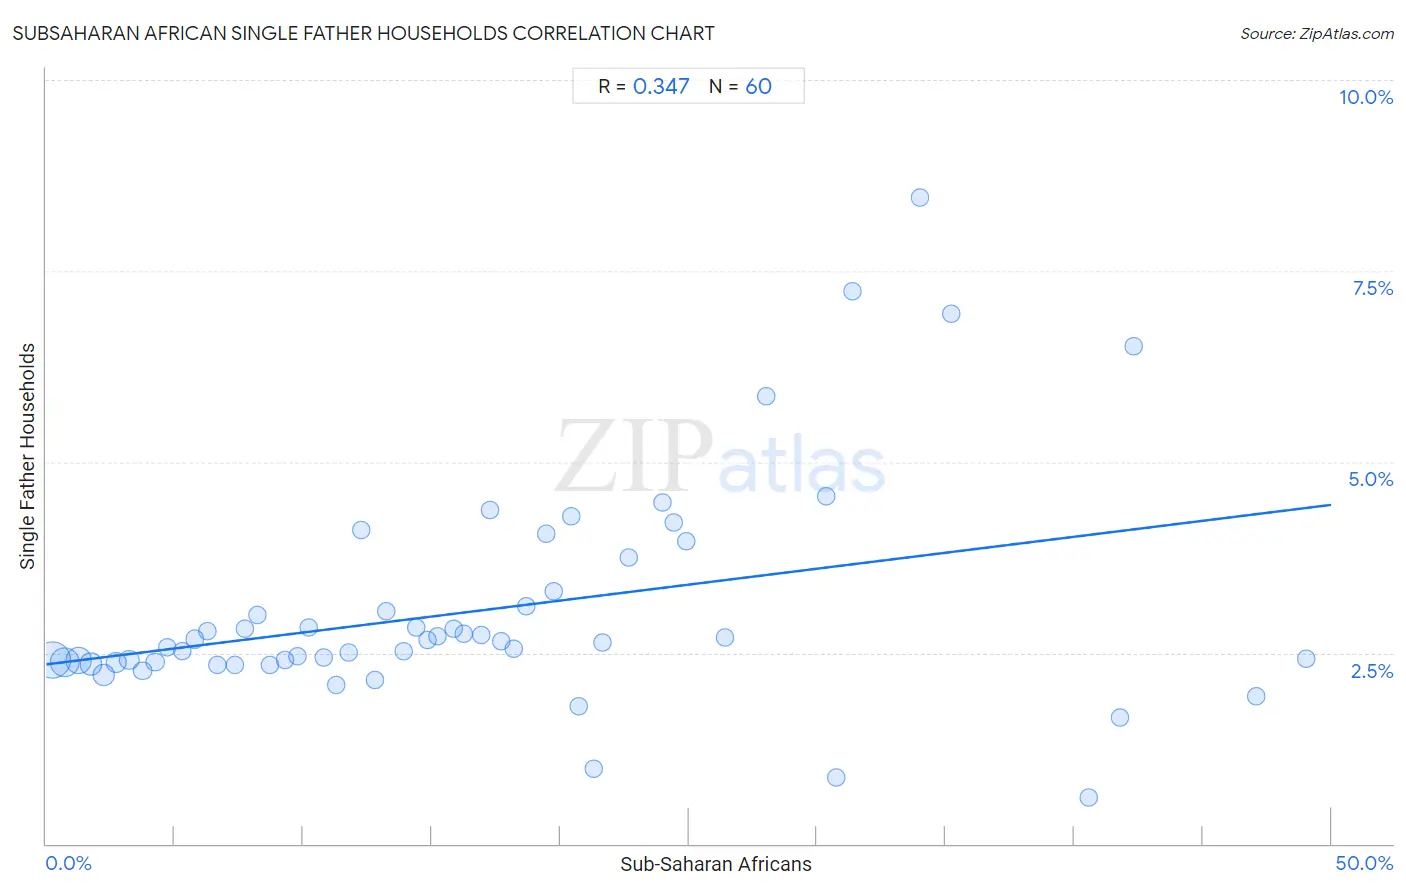
Subsaharan African Single Father Households Correlation Chart
The statistical analysis conducted on geographies consisting of 500,994,896 people shows a mild positive correlation between the proportion of Sub-Saharan Africans and percentage of single father households in the United States with a correlation coefficient (R) of 0.347 and weighted average of 2.4%. On average, for every 1% (one percent) increase in Sub-Saharan Africans within a typical geography, there is an increase of 0.042% in percentage of single father households.
It is essential to understand that the correlation between the percentage of Sub-Saharan Africans and percentage of single father households does not imply a direct cause-and-effect relationship. It remains uncertain whether the presence of Sub-Saharan Africans influences an upward or downward trend in the level of percentage of single father households within an area, or if Sub-Saharan Africans simply ended up residing in those areas with higher or lower levels of percentage of single father households due to other factors.
Demographics Similar to Sub-Saharan Africans by Single Father Households
In terms of single father households, the demographic groups most similar to Sub-Saharan Africans are Immigrants from Zaire (2.4%, a difference of 0.090%), Nonimmigrants (2.4%, a difference of 0.16%), Immigrants from Ghana (2.4%, a difference of 0.20%), American (2.4%, a difference of 0.24%), and Pennsylvania German (2.4%, a difference of 0.25%).
| Demographics | Rating | Rank | Single Father Households |
| Immigrants from Uruguay | 11.0 /100 | #223 | Poor 2.4% |
| Immigrants from Bahamas | 10.6 /100 | #224 | Poor 2.4% |
| Marshallese | 9.7 /100 | #225 | Tragic 2.4% |
| Blacks/African Americans | 9.7 /100 | #226 | Tragic 2.4% |
| Americans | 9.3 /100 | #227 | Tragic 2.4% |
| Immigrants from Ghana | 9.1 /100 | #228 | Tragic 2.4% |
| Immigrants from Zaire | 8.6 /100 | #229 | Tragic 2.4% |
| Sub-Saharan Africans | 8.3 /100 | #230 | Tragic 2.4% |
| Nonimmigrants | 7.6 /100 | #231 | Tragic 2.4% |
| Pennsylvania Germans | 7.3 /100 | #232 | Tragic 2.4% |
| Immigrants from Western Africa | 7.0 /100 | #233 | Tragic 2.4% |
| Africans | 6.3 /100 | #234 | Tragic 2.5% |
| Immigrants | 6.3 /100 | #235 | Tragic 2.5% |
| Cajuns | 6.1 /100 | #236 | Tragic 2.5% |
| Sierra Leoneans | 5.9 /100 | #237 | Tragic 2.5% |
Subsaharan African Single Father Households Correlation Summary
| Measurement | Subsaharan African Data | Single Father Households Data |
| Minimum | 0.24% | 0.60% |
| Maximum | 49.0% | 8.5% |
| Range | 48.8% | 7.9% |
| Mean | 17.0% | 3.1% |
| Median | 15.0% | 2.6% |
| Interquartile 25% (IQ1) | 7.5% | 2.4% |
| Interquartile 75% (IQ3) | 23.3% | 3.2% |
| Interquartile Range (IQR) | 15.8% | 0.83% |
| Standard Deviation (Sample) | 12.1% | 1.5% |
| Standard Deviation (Population) | 12.0% | 1.4% |
Correlation Details
| Subsaharan African Percentile | Sample Size | Single Father Households |
[ 0.0% - 0.5% ] 0.24% | 169,578,771 | 2.4% |
[ 0.5% - 1.0% ] 0.72% | 105,688,836 | 2.4% |
[ 1.0% - 1.5% ] 1.24% | 69,909,070 | 2.4% |
[ 1.5% - 2.0% ] 1.73% | 40,680,026 | 2.4% |
[ 2.0% - 2.5% ] 2.25% | 33,959,742 | 2.2% |
[ 2.5% - 3.0% ] 2.73% | 23,177,447 | 2.4% |
[ 3.0% - 3.5% ] 3.23% | 13,063,986 | 2.4% |
[ 3.5% - 4.0% ] 3.75% | 9,169,191 | 2.3% |
[ 4.0% - 4.5% ] 4.22% | 8,769,078 | 2.4% |
[ 4.5% - 5.0% ] 4.71% | 4,018,612 | 2.6% |
[ 5.0% - 5.5% ] 5.29% | 3,702,419 | 2.5% |
[ 5.5% - 6.0% ] 5.77% | 3,264,068 | 2.7% |
[ 6.0% - 6.5% ] 6.26% | 2,166,833 | 2.8% |
[ 6.5% - 7.0% ] 6.66% | 2,488,221 | 2.3% |
[ 7.0% - 7.5% ] 7.34% | 1,454,769 | 2.3% |
[ 7.5% - 8.0% ] 7.73% | 1,524,505 | 2.8% |
[ 8.0% - 8.5% ] 8.23% | 971,692 | 3.0% |
[ 8.5% - 9.0% ] 8.72% | 974,782 | 2.3% |
[ 9.0% - 9.5% ] 9.27% | 849,373 | 2.4% |
[ 9.5% - 10.0% ] 9.79% | 393,100 | 2.4% |
[ 10.0% - 10.5% ] 10.22% | 741,875 | 2.8% |
[ 10.5% - 11.0% ] 10.78% | 504,474 | 2.4% |
[ 11.0% - 11.5% ] 11.27% | 647,802 | 2.1% |
[ 11.5% - 12.0% ] 11.75% | 270,594 | 2.5% |
[ 12.0% - 12.5% ] 12.27% | 98,655 | 4.1% |
[ 12.5% - 13.0% ] 12.77% | 177,673 | 2.2% |
[ 13.0% - 13.5% ] 13.23% | 438,825 | 3.1% |
[ 13.5% - 14.0% ] 13.92% | 335,680 | 2.5% |
[ 14.0% - 14.5% ] 14.38% | 83,868 | 2.8% |
[ 14.5% - 15.0% ] 14.81% | 132,290 | 2.7% |
[ 15.0% - 15.5% ] 15.22% | 232,302 | 2.7% |
[ 15.5% - 16.0% ] 15.84% | 217,032 | 2.8% |
[ 16.0% - 16.5% ] 16.25% | 194,091 | 2.7% |
[ 16.5% - 17.0% ] 16.92% | 29,624 | 2.7% |
[ 17.0% - 17.5% ] 17.26% | 144,342 | 4.4% |
[ 17.5% - 18.0% ] 17.73% | 64,869 | 2.7% |
[ 18.0% - 18.5% ] 18.20% | 220,571 | 2.6% |
[ 18.5% - 19.0% ] 18.66% | 97,301 | 3.1% |
[ 19.0% - 19.5% ] 19.43% | 242,816 | 4.1% |
[ 19.5% - 20.0% ] 19.74% | 19,112 | 3.3% |
[ 20.0% - 20.5% ] 20.44% | 30,068 | 4.3% |
[ 20.5% - 21.0% ] 20.73% | 34,320 | 1.8% |
[ 21.0% - 21.5% ] 21.30% | 28,219 | 0.99% |
[ 21.5% - 22.0% ] 21.63% | 51,274 | 2.6% |
[ 22.5% - 23.0% ] 22.69% | 42,370 | 3.7% |
[ 23.5% - 24.0% ] 23.99% | 14,553 | 4.5% |
[ 24.0% - 24.5% ] 24.44% | 25,234 | 4.2% |
[ 24.5% - 25.0% ] 24.91% | 273 | 4.0% |
[ 26.0% - 26.5% ] 26.43% | 1,082 | 2.7% |
[ 28.0% - 28.5% ] 28.02% | 27,049 | 5.9% |
[ 30.0% - 30.5% ] 30.36% | 606 | 4.5% |
[ 30.5% - 31.0% ] 30.74% | 15,489 | 0.87% |
[ 31.0% - 31.5% ] 31.35% | 2,485 | 7.2% |
[ 34.0% - 34.5% ] 34.01% | 1,476 | 8.5% |
[ 35.0% - 35.5% ] 35.23% | 1,286 | 6.9% |
[ 40.5% - 41.0% ] 40.56% | 9,613 | 0.60% |
[ 41.5% - 42.0% ] 41.76% | 613 | 1.6% |
[ 42.0% - 42.5% ] 42.31% | 338 | 6.5% |
[ 47.0% - 47.5% ] 47.10% | 1,157 | 1.9% |
[ 49.0% - 49.5% ] 49.02% | 9,074 | 2.4% |