Panamanian 1 or more Vehicles in Household
COMPARE
Panamanian
Select to Compare
1 or more Vehicles in Household
Panamanian 1 or more Vehicles in Household
87.5%
1+ VEHICLES AVAILABLE
0.2/ 100
METRIC RATING
270th/ 347
METRIC RANK
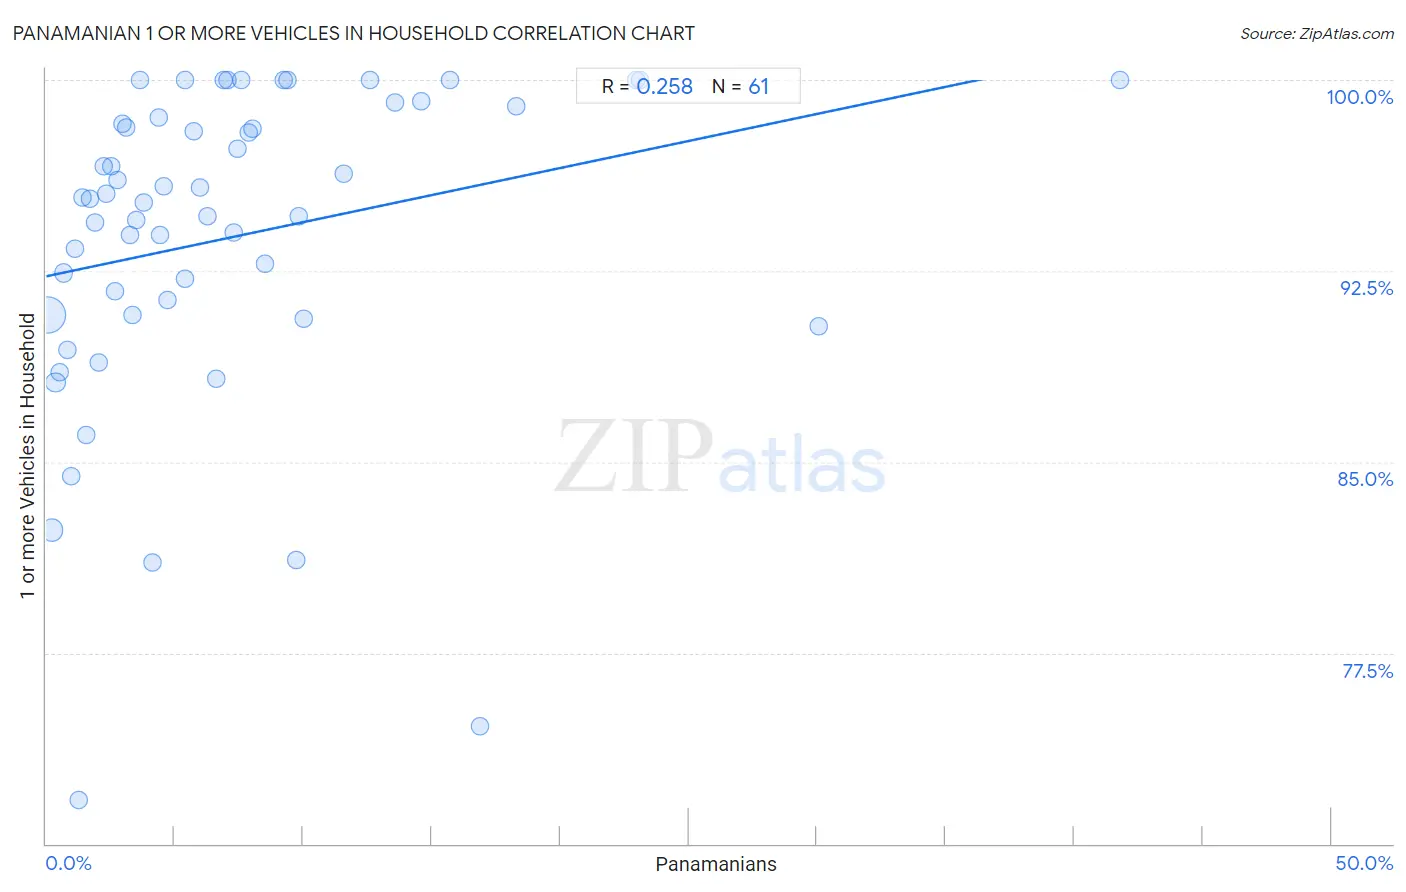
Panamanian 1 or more Vehicles in Household Correlation Chart
The statistical analysis conducted on geographies consisting of 281,086,843 people shows a weak positive correlation between the proportion of Panamanians and percentage of households with 1 or more vehicles available in the United States with a correlation coefficient (R) of 0.258 and weighted average of 87.5%. On average, for every 1% (one percent) increase in Panamanians within a typical geography, there is an increase of 0.21% in percentage of households with 1 or more vehicles available.
It is essential to understand that the correlation between the percentage of Panamanians and percentage of households with 1 or more vehicles available does not imply a direct cause-and-effect relationship. It remains uncertain whether the presence of Panamanians influences an upward or downward trend in the level of percentage of households with 1 or more vehicles available within an area, or if Panamanians simply ended up residing in those areas with higher or lower levels of percentage of households with 1 or more vehicles available due to other factors.
Demographics Similar to Panamanians by 1 or more Vehicles in Household
In terms of 1 or more vehicles in household, the demographic groups most similar to Panamanians are Immigrants from Africa (87.6%, a difference of 0.010%), Bermudan (87.5%, a difference of 0.010%), Immigrants from Europe (87.6%, a difference of 0.060%), Aleut (87.5%, a difference of 0.070%), and Immigrants from Colombia (87.6%, a difference of 0.10%).
| Demographics | Rating | Rank | 1 or more Vehicles in Household |
| Immigrants from Egypt | 0.5 /100 | #263 | Tragic 87.8% |
| Immigrants from Liberia | 0.4 /100 | #264 | Tragic 87.8% |
| Africans | 0.4 /100 | #265 | Tragic 87.8% |
| Israelis | 0.3 /100 | #266 | Tragic 87.7% |
| Immigrants from Colombia | 0.3 /100 | #267 | Tragic 87.6% |
| Immigrants from Europe | 0.2 /100 | #268 | Tragic 87.6% |
| Immigrants from Africa | 0.2 /100 | #269 | Tragic 87.6% |
| Panamanians | 0.2 /100 | #270 | Tragic 87.5% |
| Bermudans | 0.2 /100 | #271 | Tragic 87.5% |
| Aleuts | 0.2 /100 | #272 | Tragic 87.5% |
| Immigrants from Northern Africa | 0.2 /100 | #273 | Tragic 87.4% |
| Immigrants from Morocco | 0.1 /100 | #274 | Tragic 87.4% |
| Immigrants from Singapore | 0.1 /100 | #275 | Tragic 87.2% |
| Immigrants from France | 0.1 /100 | #276 | Tragic 87.1% |
| Alsatians | 0.1 /100 | #277 | Tragic 87.1% |
Panamanian 1 or more Vehicles in Household Correlation Summary
| Measurement | Panamanian Data | 1 or more Vehicles in Household Data |
| Minimum | 0.062% | 71.7% |
| Maximum | 41.8% | 100.0% |
| Range | 41.7% | 28.3% |
| Mean | 7.2% | 93.8% |
| Median | 4.7% | 95.3% |
| Interquartile 25% (IQ1) | 2.3% | 90.8% |
| Interquartile 75% (IQ3) | 9.3% | 98.7% |
| Interquartile Range (IQR) | 7.0% | 8.0% |
| Standard Deviation (Sample) | 7.6% | 6.3% |
| Standard Deviation (Population) | 7.6% | 6.2% |
Correlation Details
| Panamanian Percentile | Sample Size | 1 or more Vehicles in Household |
[ 0.0% - 0.5% ] 0.062% | 200,140,625 | 90.8% |
[ 0.0% - 0.5% ] 0.22% | 51,372,963 | 82.3% |
[ 0.0% - 0.5% ] 0.36% | 14,301,184 | 88.1% |
[ 0.5% - 1.0% ] 0.52% | 6,340,345 | 88.5% |
[ 0.5% - 1.0% ] 0.67% | 3,204,358 | 92.4% |
[ 0.5% - 1.0% ] 0.83% | 1,903,703 | 89.4% |
[ 0.5% - 1.0% ] 0.97% | 1,412,725 | 84.4% |
[ 1.0% - 1.5% ] 1.12% | 611,551 | 93.4% |
[ 1.0% - 1.5% ] 1.27% | 555,094 | 71.7% |
[ 1.0% - 1.5% ] 1.43% | 350,072 | 95.4% |
[ 1.5% - 2.0% ] 1.55% | 430,612 | 86.1% |
[ 1.5% - 2.0% ] 1.70% | 128,561 | 95.3% |
[ 1.5% - 2.0% ] 1.91% | 44,469 | 94.4% |
[ 2.0% - 2.5% ] 2.03% | 53,753 | 88.9% |
[ 2.0% - 2.5% ] 2.23% | 19,518 | 96.6% |
[ 2.0% - 2.5% ] 2.33% | 42,195 | 95.5% |
[ 2.5% - 3.0% ] 2.50% | 9,621 | 96.6% |
[ 2.5% - 3.0% ] 2.65% | 15,381 | 91.7% |
[ 2.5% - 3.0% ] 2.78% | 36,175 | 96.1% |
[ 2.5% - 3.0% ] 2.95% | 9,502 | 98.3% |
[ 3.0% - 3.5% ] 3.11% | 30,267 | 98.1% |
[ 3.0% - 3.5% ] 3.27% | 8,559 | 93.9% |
[ 3.0% - 3.5% ] 3.37% | 13,798 | 90.8% |
[ 3.5% - 4.0% ] 3.52% | 654 | 94.5% |
[ 3.5% - 4.0% ] 3.66% | 1,258 | 100.0% |
[ 3.5% - 4.0% ] 3.81% | 1,759 | 95.2% |
[ 4.0% - 4.5% ] 4.15% | 4,550 | 81.1% |
[ 4.0% - 4.5% ] 4.36% | 482 | 98.5% |
[ 4.0% - 4.5% ] 4.41% | 5,009 | 93.9% |
[ 4.5% - 5.0% ] 4.60% | 631 | 95.8% |
[ 4.5% - 5.0% ] 4.71% | 4,033 | 91.4% |
[ 5.0% - 5.5% ] 5.39% | 7,901 | 92.2% |
[ 5.0% - 5.5% ] 5.42% | 166 | 100.0% |
[ 5.5% - 6.0% ] 5.75% | 991 | 98.0% |
[ 5.5% - 6.0% ] 5.99% | 7,779 | 95.8% |
[ 6.0% - 6.5% ] 6.29% | 874 | 94.6% |
[ 6.5% - 7.0% ] 6.60% | 1,439 | 88.3% |
[ 6.5% - 7.0% ] 6.90% | 507 | 100.0% |
[ 7.0% - 7.5% ] 7.06% | 1,841 | 100.0% |
[ 7.0% - 7.5% ] 7.28% | 1,072 | 94.0% |
[ 7.0% - 7.5% ] 7.43% | 323 | 97.3% |
[ 7.5% - 8.0% ] 7.58% | 396 | 100.0% |
[ 7.5% - 8.0% ] 7.89% | 2,724 | 97.9% |
[ 8.0% - 8.5% ] 8.02% | 1,047 | 98.1% |
[ 8.0% - 8.5% ] 8.49% | 318 | 92.8% |
[ 9.0% - 9.5% ] 9.24% | 357 | 100.0% |
[ 9.0% - 9.5% ] 9.41% | 202 | 100.0% |
[ 9.5% - 10.0% ] 9.73% | 514 | 81.1% |
[ 9.5% - 10.0% ] 9.84% | 183 | 94.6% |
[ 10.0% - 10.5% ] 10.00% | 740 | 90.6% |
[ 11.5% - 12.0% ] 11.58% | 1,002 | 96.3% |
[ 12.5% - 13.0% ] 12.59% | 135 | 100.0% |
[ 13.5% - 14.0% ] 13.58% | 972 | 99.1% |
[ 14.5% - 15.0% ] 14.61% | 219 | 99.2% |
[ 15.5% - 16.0% ] 15.70% | 414 | 100.0% |
[ 16.5% - 17.0% ] 16.89% | 296 | 74.6% |
[ 18.0% - 18.5% ] 18.29% | 175 | 99.0% |
[ 22.5% - 23.0% ] 22.97% | 74 | 100.0% |
[ 23.0% - 23.5% ] 23.10% | 381 | 100.0% |
[ 30.0% - 30.5% ] 30.08% | 133 | 90.3% |
[ 41.5% - 42.0% ] 41.76% | 261 | 100.0% |