Lebanese 1 or more Vehicles in Household

COMPARE

Lebanese
Race
Ancestry
AfghanAfricanAlaska NativeAlaskan AthabascanAlbanianAleutAlsatianAmericanApacheArabArapahoArgentineanArmenianAssyrian/Chaldean/SyriacAustralianAustrianBahamianBangladeshiBarbadianBasqueBelgianBelizeanBermudanBhutaneseBlackfeetBolivianBrazilianBritishBritish West IndianBulgarianBurmeseCajunCambodianCanadianCape VerdeanCarpatho RusynCelticCentral AmericanCentral American IndianCherokeeCheyenneChickasawChileanChineseChippewaChoctawColombianColvilleComancheCosta RicanCreeCreekCroatianCrowCubanCypriotCzechCzechoslovakianDanishDelawareDominicanDutchDutch West IndianEastern EuropeanEcuadorianEgyptianEnglishEstonianEthiopianEuropeanFijianFilipinoFinnishFrenchFrench American IndianFrench CanadianGermanGerman RussianGhanaianGreekGuamanian/ChamorroGuatemalanGuyaneseHaitianHmongHonduranHopiHoumaHungarianIcelanderIndian (Asian)IndonesianInupiatIranianIraqiIrishIroquoisIsraeliItalianJamaicanJapaneseJordanianKenyanKiowaKoreanLaotianLatvianLebaneseLiberianLithuanianLumbeeLuxembourgerMacedonianMalaysianMalteseMarshalleseMenomineeMexicanMexican American IndianMongolianMoroccanNative HawaiianNavajoNepaleseNew ZealanderNicaraguanNigerianNorthern EuropeanNorwegianOkinawanOsageOttawaPaiutePakistaniPalestinianPanamanianParaguayanPennsylvania GermanPeruvianPimaPolishPortuguesePotawatomiPuebloPuerto RicanPuget Sound SalishRomanianRussianSalvadoranSamoanScandinavianScotch-IrishScottishSeminoleSenegaleseSerbianShoshoneSierra LeoneanSiouxSlavicSlovakSloveneSomaliSouth AfricanSouth AmericanSouth American IndianSoviet UnionSpaniardSpanishSpanish AmericanSpanish American IndianSri LankanSubsaharan AfricanSudaneseSwedishSwissSyrianTaiwaneseThaiTlingit-HaidaTohono O'OdhamTonganTrinidadian and TobagonianTsimshianTurkishU.S. Virgin IslanderUgandanUkrainianUruguayanUteVenezuelanVietnameseWelshWest IndianYakamaYaquiYugoslavianYumanYup'ikZimbabwean
Immigration
NonimmigrantsImmigrantsAfghanistanAfricaAlbaniaArgentinaArmeniaAsiaAustraliaAustriaBahamasBangladeshBarbadosBelarusBelgiumBelizeBoliviaBosnia and HerzegovinaBrazilBulgariaBurma/MyanmarCabo VerdeCambodiaCameroonCanadaCaribbeanCentral AmericaChileChinaColombiaCongoCosta RicaCroatiaCubaCzechoslovakiaDenmarkDominicaDominican RepublicEastern AfricaEastern AsiaEastern EuropeEcuadorEgyptEl SalvadorEnglandEritreaEthiopiaEuropeFijiFranceGermanyGhanaGreeceGrenadaGuatemalaGuyanaHaitiHondurasHong KongHungaryIndiaIndonesiaIranIraqIrelandIsraelItalyJamaicaJapanJordanKazakhstanKenyaKoreaKuwaitLaosLatin AmericaLatviaLebanonLiberiaLithuaniaMalaysiaMexicoMicronesiaMiddle AfricaMoldovaMoroccoNepalNetherlandsNicaraguaNigeriaNorth AmericaNorth MacedoniaNorthern AfricaNorthern EuropeNorwayOceaniaPakistanPanamaPeruPhilippinesPolandPortugalRomaniaRussiaSaudi ArabiaScotlandSenegalSerbiaSierra LeoneSingaporeSomaliaSouth AfricaSouth AmericaSouth Central AsiaSouth Eastern AsiaSouthern EuropeSpainSri LankaSt. Vincent and the GrenadinesSudanSwedenSwitzerlandSyriaTaiwanThailandTrinidad and TobagoTurkeyUgandaUkraineUruguayUzbekistanVenezuelaVietnamWest IndiesWestern AfricaWestern AsiaWestern EuropeYemenZaireZimbabweAzores
Select to Compare
Race
Ancestry
AfghanAfricanAlaska NativeAlaskan AthabascanAlbanianAleutAlsatianAmericanApacheArabArapahoArgentineanArmenianAssyrian/Chaldean/SyriacAustralianAustrianBahamianBangladeshiBarbadianBasqueBelgianBelizeanBermudanBhutaneseBlackfeetBolivianBrazilianBritishBritish West IndianBulgarianBurmeseCajunCambodianCanadianCape VerdeanCarpatho RusynCelticCentral AmericanCentral American IndianCherokeeCheyenneChickasawChileanChineseChippewaChoctawColombianColvilleComancheCosta RicanCreeCreekCroatianCrowCubanCypriotCzechCzechoslovakianDanishDelawareDominicanDutchDutch West IndianEastern EuropeanEcuadorianEgyptianEnglishEstonianEthiopianEuropeanFijianFilipinoFinnishFrenchFrench American IndianFrench CanadianGermanGerman RussianGhanaianGreekGuamanian/ChamorroGuatemalanGuyaneseHaitianHmongHonduranHopiHoumaHungarianIcelanderIndian (Asian)IndonesianInupiatIranianIraqiIrishIroquoisIsraeliItalianJamaicanJapaneseJordanianKenyanKiowaKoreanLaotianLatvianLiberianLithuanianLumbeeLuxembourgerMacedonianMalaysianMalteseMarshalleseMenomineeMexicanMexican American IndianMongolianMoroccanNative HawaiianNavajoNepaleseNew ZealanderNicaraguanNigerianNorthern EuropeanNorwegianOkinawanOsageOttawaPaiutePakistaniPalestinianPanamanianParaguayanPennsylvania GermanPeruvianPimaPolishPortuguesePotawatomiPuebloPuerto RicanPuget Sound SalishRomanianRussianSalvadoranSamoanScandinavianScotch-IrishScottishSeminoleSenegaleseSerbianShoshoneSierra LeoneanSiouxSlavicSlovakSloveneSomaliSouth AfricanSouth AmericanSouth American IndianSoviet UnionSpaniardSpanishSpanish AmericanSpanish American IndianSri LankanSubsaharan AfricanSudaneseSwedishSwissSyrianTaiwaneseThaiTlingit-HaidaTohono O'OdhamTonganTrinidadian and TobagonianTsimshianTurkishU.S. Virgin IslanderUgandanUkrainianUruguayanUteVenezuelanVietnameseWelshWest IndianYakamaYaquiYugoslavianYumanYup'ikZimbabwean
Immigration
NonimmigrantsImmigrantsAfghanistanAfricaAlbaniaArgentinaArmeniaAsiaAustraliaAustriaBahamasBangladeshBarbadosBelarusBelgiumBelizeBoliviaBosnia and HerzegovinaBrazilBulgariaBurma/MyanmarCabo VerdeCambodiaCameroonCanadaCaribbeanCentral AmericaChileChinaColombiaCongoCosta RicaCroatiaCubaCzechoslovakiaDenmarkDominicaDominican RepublicEastern AfricaEastern AsiaEastern EuropeEcuadorEgyptEl SalvadorEnglandEritreaEthiopiaEuropeFijiFranceGermanyGhanaGreeceGrenadaGuatemalaGuyanaHaitiHondurasHong KongHungaryIndiaIndonesiaIranIraqIrelandIsraelItalyJamaicaJapanJordanKazakhstanKenyaKoreaKuwaitLaosLatin AmericaLatviaLebanonLiberiaLithuaniaMalaysiaMexicoMicronesiaMiddle AfricaMoldovaMoroccoNepalNetherlandsNicaraguaNigeriaNorth AmericaNorth MacedoniaNorthern AfricaNorthern EuropeNorwayOceaniaPakistanPanamaPeruPhilippinesPolandPortugalRomaniaRussiaSaudi ArabiaScotlandSenegalSerbiaSierra LeoneSingaporeSomaliaSouth AfricaSouth AmericaSouth Central AsiaSouth Eastern AsiaSouthern EuropeSpainSri LankaSt. Vincent and the GrenadinesSudanSwedenSwitzerlandSyriaTaiwanThailandTrinidad and TobagoTurkeyUgandaUkraineUruguayUzbekistanVenezuelaVietnamWest IndiesWestern AfricaWestern AsiaWestern EuropeYemenZaireZimbabweAzores
1 or more Vehicles in Household
Income
Poverty
Unemployment
Labor Participation
Family Structure
Vehicle Availability
Education Level
Disability

Lebanese 1 or more Vehicles in Household
Exceptional

91.4%
1+ VEHICLES AVAILABLE
99.3/ 100
METRIC RATING
82nd/ 347
METRIC RANK

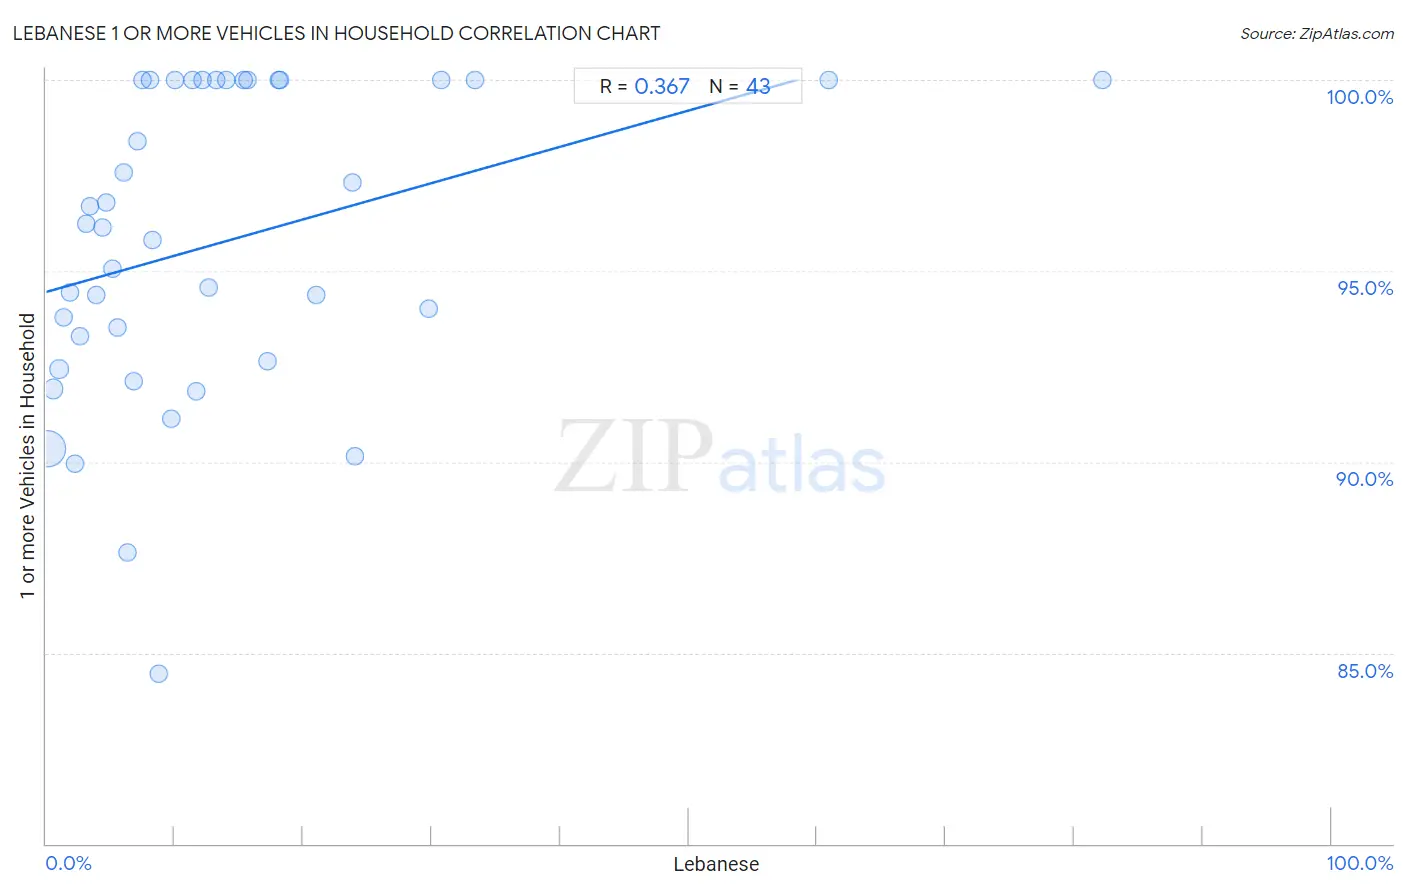
Lebanese 1 or more Vehicles in Household Correlation Chart

The statistical analysis conducted on geographies consisting of 401,375,965 people shows a mild positive correlation between the proportion of Lebanese and percentage of households with 1 or more vehicles available in the United States with a correlation coefficient (R) of 0.367 and weighted average of 91.4%. On average, for every 1% (one percent) increase in Lebanese within a typical geography, there is an increase of 0.095% in percentage of households with 1 or more vehicles available.
Lebanese 1 or more Vehicles in Household
It is essential to understand that the correlation between the percentage of Lebanese and percentage of households with 1 or more vehicles available does not imply a direct cause-and-effect relationship. It remains uncertain whether the presence of Lebanese influences an upward or downward trend in the level of percentage of households with 1 or more vehicles available within an area, or if Lebanese simply ended up residing in those areas with higher or lower levels of percentage of households with 1 or more vehicles available due to other factors.

Demographics Similar to Lebanese by 1 or more Vehicles in Household

In terms of 1 or more vehicles in household, the demographic groups most similar to Lebanese are Immigrants from England (91.4%, a difference of 0.0%), Immigrants from South Eastern Asia (91.4%, a difference of 0.010%), Jordanian (91.4%, a difference of 0.020%), Tsimshian (91.4%, a difference of 0.020%), and Immigrants from South Central Asia (91.5%, a difference of 0.040%).
DemographicsRating | Rank1 or more Vehicles in Household
Portuguese
99.5
/100
|
#75
Exceptional
91.6%
Cubans
99.5
/100
|
#76
Exceptional
91.5%
Immigrants from Philippines
99.4
/100
|
#77
Exceptional
91.5%
Iranians
99.4
/100
|
#78
Exceptional
91.5%
Immigrants from South Central Asia
99.4
/100
|
#79
Exceptional
91.5%
Bolivians
99.4
/100
|
#80
Exceptional
91.5%
Immigrants from South Eastern Asia
99.3
/100
|
#81
Exceptional
91.4%
Lebanese
99.3
/100
|
#82
Exceptional
91.4%
Immigrants from England
99.3
/100
|
#83
Exceptional
91.4%
Jordanians
99.3
/100
|
#84
Exceptional
91.4%
Tsimshian
99.3
/100
|
#85
Exceptional
91.4%
Osage
99.2
/100
|
#86
Exceptional
91.4%
Immigrants from Germany
99.2
/100
|
#87
Exceptional
91.4%
Spanish Americans
99.2
/100
|
#88
Exceptional
91.4%
Bangladeshis
99.2
/100
|
#89
Exceptional
91.4%

Lebanese 1 or more Vehicles in Household Correlation Summary

MeasurementLebanese Data1 or more Vehicles in Household Data
Minimum0.14%84.4%
Maximum82.2%100.0%
Range82.1%15.6%
Mean13.6%95.7%
Median8.7%96.1%
Interquartile 25% (IQ1)4.3%92.6%
Interquartile 75% (IQ3)17.2%100.0%
Interquartile Range (IQR)12.9%7.4%
Standard Deviation (Sample)15.6%4.0%
Standard Deviation (Population)15.4%4.0%

Correlation Details

Lebanese PercentileSample Size1 or more Vehicles in Household
[
0.0%
-
0.5%
]
0.14%
348,512,45690.3%
[
0.5%
-
1.0%
]
0.55%
37,621,10091.9%
[
0.5%
-
1.0%
]
0.99%
8,817,53492.4%
[
1.0%
-
1.5%
]
1.39%
3,364,49393.8%
[
1.5%
-
2.0%
]
1.83%
1,219,75094.4%
[
2.0%
-
2.5%
]
2.21%
622,66989.9%
[
2.5%
-
3.0%
]
2.60%
424,18893.3%
[
3.0%
-
3.5%
]
3.10%
160,18696.2%
[
3.0%
-
3.5%
]
3.42%
83,90996.7%
[
3.5%
-
4.0%
]
3.90%
132,80194.4%
[
4.0%
-
4.5%
]
4.35%
14,44796.1%
[
4.5%
-
5.0%
]
4.70%
19,35296.8%
[
5.0%
-
5.5%
]
5.16%
31,75295.0%
[
5.5%
-
6.0%
]
5.51%
11,17993.5%
[
6.0%
-
6.5%
]
6.00%
91697.6%
[
6.0%
-
6.5%
]
6.34%
1,23187.6%
[
6.5%
-
7.0%
]
6.78%
8,72092.1%
[
7.0%
-
7.5%
]
7.08%
7,98298.4%
[
7.5%
-
8.0%
]
7.52%
1,277100.0%
[
8.0%
-
8.5%
]
8.11%
37100.0%
[
8.0%
-
8.5%
]
8.31%
34,67695.8%
[
8.5%
-
9.0%
]
8.72%
47084.4%
[
9.5%
-
10.0%
]
9.72%
1,03991.1%
[
10.0%
-
10.5%
]
10.02%
479100.0%
[
11.0%
-
11.5%
]
11.40%
772100.0%
[
11.5%
-
12.0%
]
11.67%
18091.9%
[
12.0%
-
12.5%
]
12.12%
726100.0%
[
12.5%
-
13.0%
]
12.67%
2,35994.6%
[
13.0%
-
13.5%
]
13.22%
469100.0%
[
13.5%
-
14.0%
]
13.97%
229100.0%
[
15.0%
-
15.5%
]
15.38%
156100.0%
[
15.5%
-
16.0%
]
15.63%
531100.0%
[
17.0%
-
17.5%
]
17.21%
108,58892.6%
[
18.0%
-
18.5%
]
18.09%
94100.0%
[
18.0%
-
18.5%
]
18.18%
66100.0%
[
21.0%
-
21.5%
]
21.06%
62,47494.4%
[
23.5%
-
24.0%
]
23.82%
12,40597.3%
[
24.0%
-
24.5%
]
24.07%
53,04490.1%
[
29.5%
-
30.0%
]
29.74%
40,39294.0%
[
30.5%
-
31.0%
]
30.77%
52100.0%
[
33.0%
-
33.5%
]
33.33%
18100.0%
[
60.5%
-
61.0%
]
60.91%
660100.0%
[
82.0%
-
82.5%
]
82.24%
107100.0%