Subsaharan African No Schooling Completed
COMPARE
Subsaharan African
Select to Compare
No Schooling Completed
Subsaharan African No Schooling Completed
2.3%
NO SCHOOLING
4.7/ 100
METRIC RATING
222nd/ 347
METRIC RANK
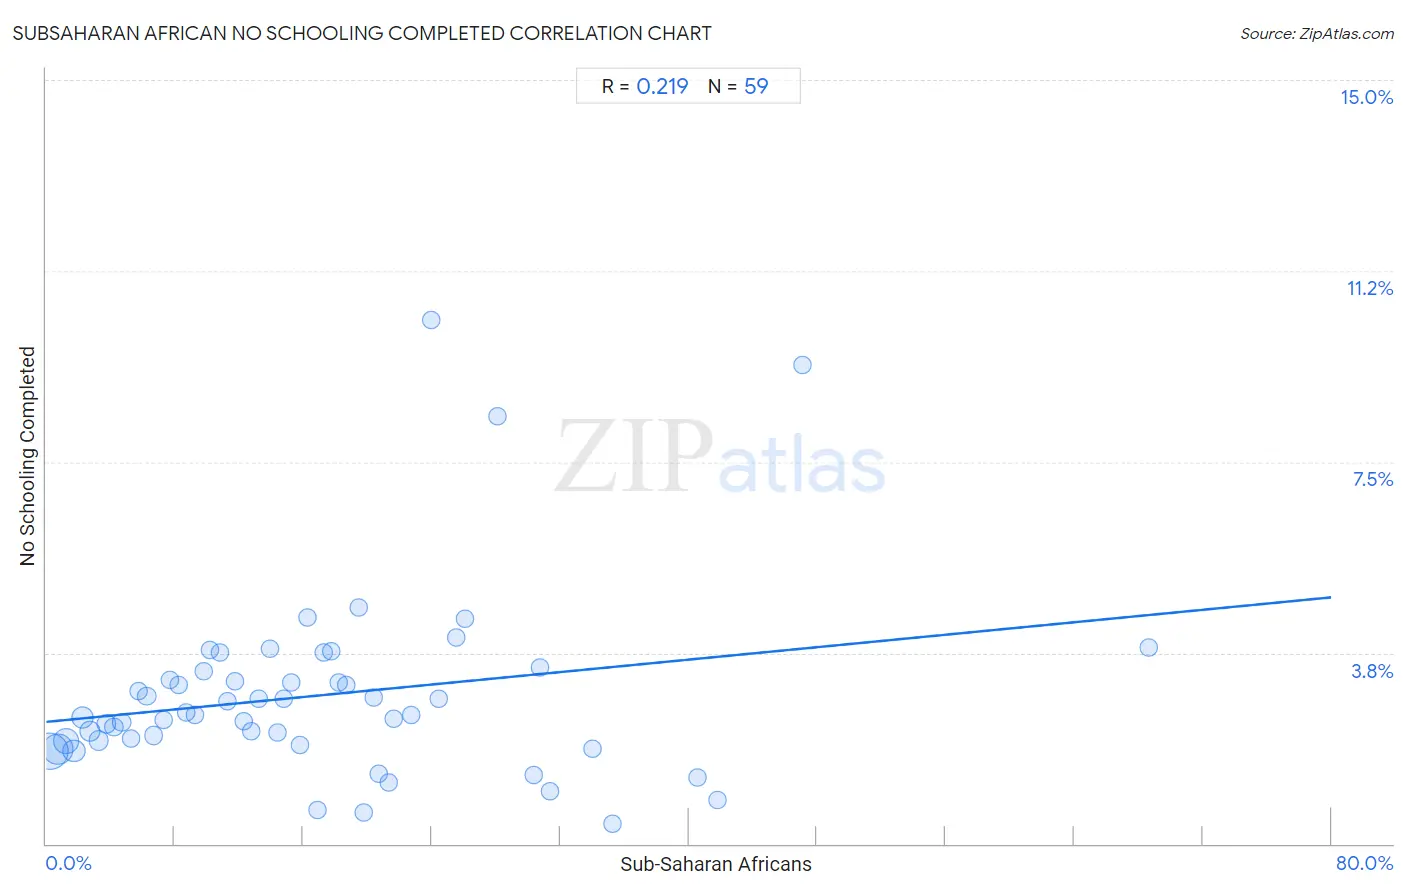
Subsaharan African No Schooling Completed Correlation Chart
The statistical analysis conducted on geographies consisting of 500,622,971 people shows a weak positive correlation between the proportion of Sub-Saharan Africans and percentage of population with no schooling in the United States with a correlation coefficient (R) of 0.219 and weighted average of 2.3%. On average, for every 1% (one percent) increase in Sub-Saharan Africans within a typical geography, there is an increase of 0.031% in percentage of population with no schooling.
It is essential to understand that the correlation between the percentage of Sub-Saharan Africans and percentage of population with no schooling does not imply a direct cause-and-effect relationship. It remains uncertain whether the presence of Sub-Saharan Africans influences an upward or downward trend in the level of percentage of population with no schooling within an area, or if Sub-Saharan Africans simply ended up residing in those areas with higher or lower levels of percentage of population with no schooling due to other factors.
Demographics Similar to Sub-Saharan Africans by No Schooling Completed
In terms of no schooling completed, the demographic groups most similar to Sub-Saharan Africans are Immigrants from Lebanon (2.3%, a difference of 0.15%), Immigrants from Sudan (2.3%, a difference of 0.17%), Immigrants from Costa Rica (2.3%, a difference of 0.26%), Tohono O'odham (2.3%, a difference of 0.44%), and Sudanese (2.3%, a difference of 0.44%).
| Demographics | Rating | Rank | No Schooling Completed |
| Immigrants from Zaire | 7.2 /100 | #215 | Tragic 2.3% |
| Tongans | 6.8 /100 | #216 | Tragic 2.3% |
| Immigrants from Syria | 6.6 /100 | #217 | Tragic 2.3% |
| Immigrants from Nepal | 6.4 /100 | #218 | Tragic 2.3% |
| Senegalese | 5.6 /100 | #219 | Tragic 2.3% |
| Immigrants from Costa Rica | 5.1 /100 | #220 | Tragic 2.3% |
| Immigrants from Sudan | 5.0 /100 | #221 | Tragic 2.3% |
| Sub-Saharan Africans | 4.7 /100 | #222 | Tragic 2.3% |
| Immigrants from Lebanon | 4.5 /100 | #223 | Tragic 2.3% |
| Tohono O'odham | 4.1 /100 | #224 | Tragic 2.3% |
| Sudanese | 4.1 /100 | #225 | Tragic 2.3% |
| Sierra Leoneans | 4.1 /100 | #226 | Tragic 2.3% |
| Immigrants from Uganda | 4.0 /100 | #227 | Tragic 2.3% |
| U.S. Virgin Islanders | 3.7 /100 | #228 | Tragic 2.3% |
| Immigrants from Pakistan | 3.6 /100 | #229 | Tragic 2.3% |
Subsaharan African No Schooling Completed Correlation Summary
| Measurement | Subsaharan African Data | No Schooling Completed Data |
| Minimum | 0.24% | 0.39% |
| Maximum | 68.6% | 10.3% |
| Range | 68.4% | 9.9% |
| Mean | 16.9% | 2.9% |
| Median | 14.8% | 2.5% |
| Interquartile 25% (IQ1) | 7.3% | 2.0% |
| Interquartile 75% (IQ3) | 22.7% | 3.4% |
| Interquartile Range (IQR) | 15.4% | 1.4% |
| Standard Deviation (Sample) | 12.9% | 1.8% |
| Standard Deviation (Population) | 12.8% | 1.8% |
Correlation Details
| Subsaharan African Percentile | Sample Size | No Schooling Completed |
[ 0.0% - 0.5% ] 0.24% | 169,089,743 | 1.8% |
[ 0.5% - 1.0% ] 0.72% | 105,482,158 | 1.9% |
[ 1.0% - 1.5% ] 1.24% | 69,974,930 | 2.0% |
[ 1.5% - 2.0% ] 1.73% | 40,821,923 | 1.8% |
[ 2.0% - 2.5% ] 2.25% | 33,955,759 | 2.5% |
[ 2.5% - 3.0% ] 2.73% | 23,201,458 | 2.2% |
[ 3.0% - 3.5% ] 3.23% | 13,032,369 | 2.0% |
[ 3.5% - 4.0% ] 3.75% | 9,229,204 | 2.4% |
[ 4.0% - 4.5% ] 4.22% | 8,798,966 | 2.3% |
[ 4.5% - 5.0% ] 4.71% | 3,997,615 | 2.4% |
[ 5.0% - 5.5% ] 5.29% | 3,697,822 | 2.1% |
[ 5.5% - 6.0% ] 5.77% | 3,260,136 | 3.0% |
[ 6.0% - 6.5% ] 6.26% | 2,164,868 | 2.9% |
[ 6.5% - 7.0% ] 6.66% | 2,492,873 | 2.1% |
[ 7.0% - 7.5% ] 7.34% | 1,458,996 | 2.4% |
[ 7.5% - 8.0% ] 7.73% | 1,527,770 | 3.2% |
[ 8.0% - 8.5% ] 8.23% | 979,224 | 3.1% |
[ 8.5% - 9.0% ] 8.72% | 979,685 | 2.6% |
[ 9.0% - 9.5% ] 9.27% | 852,498 | 2.5% |
[ 9.5% - 10.0% ] 9.79% | 397,376 | 3.4% |
[ 10.0% - 10.5% ] 10.22% | 751,059 | 3.8% |
[ 10.5% - 11.0% ] 10.78% | 511,168 | 3.8% |
[ 11.0% - 11.5% ] 11.27% | 652,117 | 2.8% |
[ 11.5% - 12.0% ] 11.75% | 273,750 | 3.2% |
[ 12.0% - 12.5% ] 12.26% | 96,304 | 2.4% |
[ 12.5% - 13.0% ] 12.77% | 181,474 | 2.2% |
[ 13.0% - 13.5% ] 13.23% | 435,801 | 2.8% |
[ 13.5% - 14.0% ] 13.91% | 348,397 | 3.8% |
[ 14.0% - 14.5% ] 14.38% | 82,870 | 2.2% |
[ 14.5% - 15.0% ] 14.82% | 128,500 | 2.8% |
[ 15.0% - 15.5% ] 15.22% | 236,255 | 3.2% |
[ 15.5% - 16.0% ] 15.83% | 215,282 | 1.9% |
[ 16.0% - 16.5% ] 16.25% | 194,091 | 4.5% |
[ 16.5% - 17.0% ] 16.92% | 28,264 | 0.66% |
[ 17.0% - 17.5% ] 17.26% | 145,391 | 3.8% |
[ 17.5% - 18.0% ] 17.72% | 61,834 | 3.8% |
[ 18.0% - 18.5% ] 18.20% | 220,571 | 3.2% |
[ 18.5% - 19.0% ] 18.66% | 97,301 | 3.1% |
[ 19.0% - 19.5% ] 19.43% | 243,201 | 4.7% |
[ 19.5% - 20.0% ] 19.74% | 19,821 | 0.62% |
[ 20.0% - 20.5% ] 20.40% | 38,309 | 2.9% |
[ 20.5% - 21.0% ] 20.73% | 34,320 | 1.4% |
[ 21.0% - 21.5% ] 21.32% | 25,224 | 1.2% |
[ 21.5% - 22.0% ] 21.63% | 51,274 | 2.4% |
[ 22.5% - 23.0% ] 22.71% | 51,026 | 2.5% |
[ 23.5% - 24.0% ] 23.99% | 14,553 | 10.3% |
[ 24.0% - 24.5% ] 24.44% | 24,795 | 2.8% |
[ 25.5% - 26.0% ] 25.54% | 881 | 4.0% |
[ 26.0% - 26.5% ] 26.04% | 1,056 | 4.4% |
[ 28.0% - 28.5% ] 28.06% | 29,898 | 8.4% |
[ 30.0% - 30.5% ] 30.36% | 606 | 1.4% |
[ 30.5% - 31.0% ] 30.74% | 15,489 | 3.5% |
[ 31.0% - 31.5% ] 31.35% | 2,485 | 1.0% |
[ 34.0% - 34.5% ] 34.01% | 1,476 | 1.9% |
[ 35.0% - 35.5% ] 35.23% | 1,286 | 0.39% |
[ 40.5% - 41.0% ] 40.56% | 9,613 | 1.3% |
[ 41.5% - 42.0% ] 41.76% | 613 | 0.85% |
[ 47.0% - 47.5% ] 47.10% | 1,157 | 9.4% |
[ 68.5% - 69.0% ] 68.60% | 86 | 3.8% |