Icelander 1 or more Vehicles in Household

COMPARE

Icelander
Race
Ancestry
AfghanAfricanAlaska NativeAlaskan AthabascanAlbanianAleutAlsatianAmericanApacheArabArapahoArgentineanArmenianAssyrian/Chaldean/SyriacAustralianAustrianBahamianBangladeshiBarbadianBasqueBelgianBelizeanBermudanBhutaneseBlackfeetBolivianBrazilianBritishBritish West IndianBulgarianBurmeseCajunCambodianCanadianCape VerdeanCarpatho RusynCelticCentral AmericanCentral American IndianCherokeeCheyenneChickasawChileanChineseChippewaChoctawColombianColvilleComancheCosta RicanCreeCreekCroatianCrowCubanCypriotCzechCzechoslovakianDanishDelawareDominicanDutchDutch West IndianEastern EuropeanEcuadorianEgyptianEnglishEstonianEthiopianEuropeanFijianFilipinoFinnishFrenchFrench American IndianFrench CanadianGermanGerman RussianGhanaianGreekGuamanian/ChamorroGuatemalanGuyaneseHaitianHmongHonduranHopiHoumaHungarianIcelanderIndian (Asian)IndonesianInupiatIranianIraqiIrishIroquoisIsraeliItalianJamaicanJapaneseJordanianKenyanKiowaKoreanLaotianLatvianLebaneseLiberianLithuanianLumbeeLuxembourgerMacedonianMalaysianMalteseMarshalleseMenomineeMexicanMexican American IndianMongolianMoroccanNative HawaiianNavajoNepaleseNew ZealanderNicaraguanNigerianNorthern EuropeanNorwegianOkinawanOsageOttawaPaiutePakistaniPalestinianPanamanianParaguayanPennsylvania GermanPeruvianPimaPolishPortuguesePotawatomiPuebloPuerto RicanPuget Sound SalishRomanianRussianSalvadoranSamoanScandinavianScotch-IrishScottishSeminoleSenegaleseSerbianShoshoneSierra LeoneanSiouxSlavicSlovakSloveneSomaliSouth AfricanSouth AmericanSouth American IndianSoviet UnionSpaniardSpanishSpanish AmericanSpanish American IndianSri LankanSubsaharan AfricanSudaneseSwedishSwissSyrianTaiwaneseThaiTlingit-HaidaTohono O'OdhamTonganTrinidadian and TobagonianTsimshianTurkishU.S. Virgin IslanderUgandanUkrainianUruguayanUteVenezuelanVietnameseWelshWest IndianYakamaYaquiYugoslavianYumanYup'ikZimbabwean
Immigration
NonimmigrantsImmigrantsAfghanistanAfricaAlbaniaArgentinaArmeniaAsiaAustraliaAustriaBahamasBangladeshBarbadosBelarusBelgiumBelizeBoliviaBosnia and HerzegovinaBrazilBulgariaBurma/MyanmarCabo VerdeCambodiaCameroonCanadaCaribbeanCentral AmericaChileChinaColombiaCongoCosta RicaCroatiaCubaCzechoslovakiaDenmarkDominicaDominican RepublicEastern AfricaEastern AsiaEastern EuropeEcuadorEgyptEl SalvadorEnglandEritreaEthiopiaEuropeFijiFranceGermanyGhanaGreeceGrenadaGuatemalaGuyanaHaitiHondurasHong KongHungaryIndiaIndonesiaIranIraqIrelandIsraelItalyJamaicaJapanJordanKazakhstanKenyaKoreaKuwaitLaosLatin AmericaLatviaLebanonLiberiaLithuaniaMalaysiaMexicoMicronesiaMiddle AfricaMoldovaMoroccoNepalNetherlandsNicaraguaNigeriaNorth AmericaNorth MacedoniaNorthern AfricaNorthern EuropeNorwayOceaniaPakistanPanamaPeruPhilippinesPolandPortugalRomaniaRussiaSaudi ArabiaScotlandSenegalSerbiaSierra LeoneSingaporeSomaliaSouth AfricaSouth AmericaSouth Central AsiaSouth Eastern AsiaSouthern EuropeSpainSri LankaSt. Vincent and the GrenadinesSudanSwedenSwitzerlandSyriaTaiwanThailandTrinidad and TobagoTurkeyUgandaUkraineUruguayUzbekistanVenezuelaVietnamWest IndiesWestern AfricaWestern AsiaWestern EuropeYemenZaireZimbabweAzores
Select to Compare
Race
Ancestry
AfghanAfricanAlaska NativeAlaskan AthabascanAlbanianAleutAlsatianAmericanApacheArabArapahoArgentineanArmenianAssyrian/Chaldean/SyriacAustralianAustrianBahamianBangladeshiBarbadianBasqueBelgianBelizeanBermudanBhutaneseBlackfeetBolivianBrazilianBritishBritish West IndianBulgarianBurmeseCajunCambodianCanadianCape VerdeanCarpatho RusynCelticCentral AmericanCentral American IndianCherokeeCheyenneChickasawChileanChineseChippewaChoctawColombianColvilleComancheCosta RicanCreeCreekCroatianCrowCubanCypriotCzechCzechoslovakianDanishDelawareDominicanDutchDutch West IndianEastern EuropeanEcuadorianEgyptianEnglishEstonianEthiopianEuropeanFijianFilipinoFinnishFrenchFrench American IndianFrench CanadianGermanGerman RussianGhanaianGreekGuamanian/ChamorroGuatemalanGuyaneseHaitianHmongHonduranHopiHoumaHungarianIndian (Asian)IndonesianInupiatIranianIraqiIrishIroquoisIsraeliItalianJamaicanJapaneseJordanianKenyanKiowaKoreanLaotianLatvianLebaneseLiberianLithuanianLumbeeLuxembourgerMacedonianMalaysianMalteseMarshalleseMenomineeMexicanMexican American IndianMongolianMoroccanNative HawaiianNavajoNepaleseNew ZealanderNicaraguanNigerianNorthern EuropeanNorwegianOkinawanOsageOttawaPaiutePakistaniPalestinianPanamanianParaguayanPennsylvania GermanPeruvianPimaPolishPortuguesePotawatomiPuebloPuerto RicanPuget Sound SalishRomanianRussianSalvadoranSamoanScandinavianScotch-IrishScottishSeminoleSenegaleseSerbianShoshoneSierra LeoneanSiouxSlavicSlovakSloveneSomaliSouth AfricanSouth AmericanSouth American IndianSoviet UnionSpaniardSpanishSpanish AmericanSpanish American IndianSri LankanSubsaharan AfricanSudaneseSwedishSwissSyrianTaiwaneseThaiTlingit-HaidaTohono O'OdhamTonganTrinidadian and TobagonianTsimshianTurkishU.S. Virgin IslanderUgandanUkrainianUruguayanUteVenezuelanVietnameseWelshWest IndianYakamaYaquiYugoslavianYumanYup'ikZimbabwean
Immigration
NonimmigrantsImmigrantsAfghanistanAfricaAlbaniaArgentinaArmeniaAsiaAustraliaAustriaBahamasBangladeshBarbadosBelarusBelgiumBelizeBoliviaBosnia and HerzegovinaBrazilBulgariaBurma/MyanmarCabo VerdeCambodiaCameroonCanadaCaribbeanCentral AmericaChileChinaColombiaCongoCosta RicaCroatiaCubaCzechoslovakiaDenmarkDominicaDominican RepublicEastern AfricaEastern AsiaEastern EuropeEcuadorEgyptEl SalvadorEnglandEritreaEthiopiaEuropeFijiFranceGermanyGhanaGreeceGrenadaGuatemalaGuyanaHaitiHondurasHong KongHungaryIndiaIndonesiaIranIraqIrelandIsraelItalyJamaicaJapanJordanKazakhstanKenyaKoreaKuwaitLaosLatin AmericaLatviaLebanonLiberiaLithuaniaMalaysiaMexicoMicronesiaMiddle AfricaMoldovaMoroccoNepalNetherlandsNicaraguaNigeriaNorth AmericaNorth MacedoniaNorthern AfricaNorthern EuropeNorwayOceaniaPakistanPanamaPeruPhilippinesPolandPortugalRomaniaRussiaSaudi ArabiaScotlandSenegalSerbiaSierra LeoneSingaporeSomaliaSouth AfricaSouth AmericaSouth Central AsiaSouth Eastern AsiaSouthern EuropeSpainSri LankaSt. Vincent and the GrenadinesSudanSwedenSwitzerlandSyriaTaiwanThailandTrinidad and TobagoTurkeyUgandaUkraineUruguayUzbekistanVenezuelaVietnamWest IndiesWestern AfricaWestern AsiaWestern EuropeYemenZaireZimbabweAzores
1 or more Vehicles in Household
Income
Poverty
Unemployment
Labor Participation
Family Structure
Vehicle Availability
Education Level
Disability

Icelander 1 or more Vehicles in Household
Exceptional

90.5%
1+ VEHICLES AVAILABLE
92.1/ 100
METRIC RATING
121st/ 347
METRIC RANK

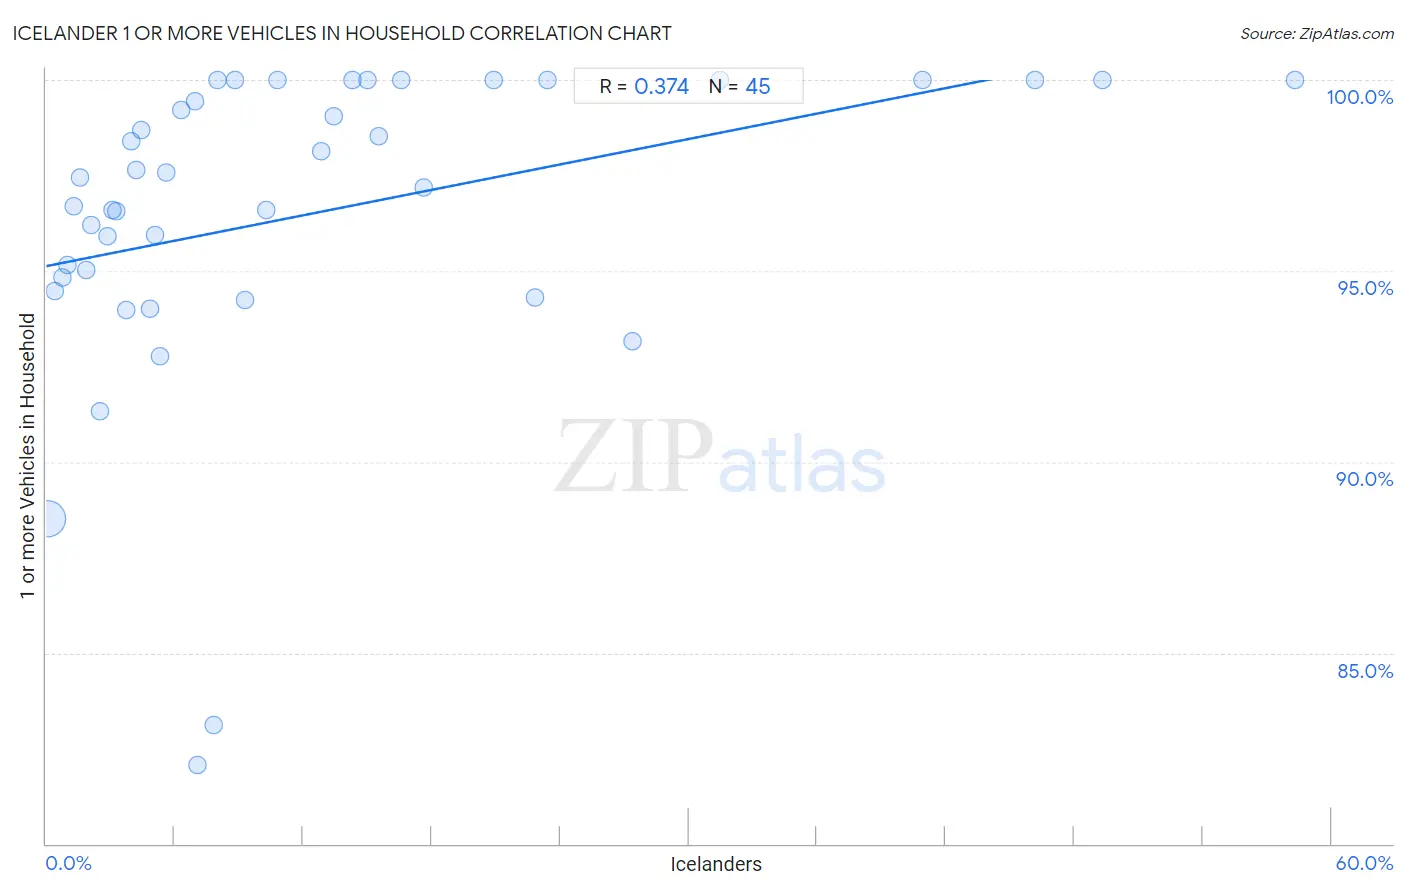
Icelander 1 or more Vehicles in Household Correlation Chart

The statistical analysis conducted on geographies consisting of 159,626,403 people shows a mild positive correlation between the proportion of Icelanders and percentage of households with 1 or more vehicles available in the United States with a correlation coefficient (R) of 0.374 and weighted average of 90.5%. On average, for every 1% (one percent) increase in Icelanders within a typical geography, there is an increase of 0.11% in percentage of households with 1 or more vehicles available.
Icelander 1 or more Vehicles in Household
It is essential to understand that the correlation between the percentage of Icelanders and percentage of households with 1 or more vehicles available does not imply a direct cause-and-effect relationship. It remains uncertain whether the presence of Icelanders influences an upward or downward trend in the level of percentage of households with 1 or more vehicles available within an area, or if Icelanders simply ended up residing in those areas with higher or lower levels of percentage of households with 1 or more vehicles available due to other factors.

Demographics Similar to Icelanders by 1 or more Vehicles in Household

In terms of 1 or more vehicles in household, the demographic groups most similar to Icelanders are Immigrants from Thailand (90.6%, a difference of 0.010%), Costa Rican (90.5%, a difference of 0.010%), Fijian (90.5%, a difference of 0.010%), Blackfeet (90.6%, a difference of 0.030%), and Puget Sound Salish (90.5%, a difference of 0.030%).
DemographicsRating | Rank1 or more Vehicles in Household
Armenians
94.5
/100
|
#114
Exceptional
90.7%
Serbians
94.3
/100
|
#115
Exceptional
90.7%
Chippewa
94.3
/100
|
#116
Exceptional
90.7%
Greeks
93.5
/100
|
#117
Exceptional
90.6%
Japanese
93.4
/100
|
#118
Exceptional
90.6%
Blackfeet
92.6
/100
|
#119
Exceptional
90.6%
Immigrants from Thailand
92.3
/100
|
#120
Exceptional
90.6%
Icelanders
92.1
/100
|
#121
Exceptional
90.5%
Costa Ricans
92.0
/100
|
#122
Exceptional
90.5%
Fijians
91.8
/100
|
#123
Exceptional
90.5%
Puget Sound Salish
91.5
/100
|
#124
Exceptional
90.5%
Immigrants from Korea
90.5
/100
|
#125
Exceptional
90.5%
Immigrants from Cameroon
89.4
/100
|
#126
Excellent
90.4%
Immigrants from the Azores
89.1
/100
|
#127
Excellent
90.4%
Burmese
89.0
/100
|
#128
Excellent
90.4%

Icelander 1 or more Vehicles in Household Correlation Summary

MeasurementIcelander Data1 or more Vehicles in Household Data
Minimum0.041%82.1%
Maximum58.3%100.0%
Range58.3%17.9%
Mean12.4%96.5%
Median7.0%97.5%
Interquartile 25% (IQ1)3.2%94.7%
Interquartile 75% (IQ3)16.0%100.0%
Interquartile Range (IQR)12.8%5.3%
Standard Deviation (Sample)13.8%4.1%
Standard Deviation (Population)13.7%4.1%

Correlation Details

Icelander PercentileSample Size1 or more Vehicles in Household
[
0.0%
-
0.5%
]
0.041%
155,047,95488.5%
[
0.0%
-
0.5%
]
0.41%
3,268,44194.5%
[
0.5%
-
1.0%
]
0.74%
704,09494.8%
[
0.5%
-
1.0%
]
1.00%
326,68495.2%
[
1.0%
-
1.5%
]
1.29%
103,35296.7%
[
1.5%
-
2.0%
]
1.59%
63,74797.5%
[
1.5%
-
2.0%
]
1.89%
31,50795.0%
[
2.0%
-
2.5%
]
2.13%
23,39096.2%
[
2.5%
-
3.0%
]
2.51%
7,69991.3%
[
2.5%
-
3.0%
]
2.83%
13,03495.9%
[
3.0%
-
3.5%
]
3.10%
6,03396.6%
[
3.0%
-
3.5%
]
3.30%
1,91196.6%
[
3.5%
-
4.0%
]
3.74%
88294.0%
[
3.5%
-
4.0%
]
3.98%
4,62098.4%
[
4.0%
-
4.5%
]
4.18%
1,48297.6%
[
4.0%
-
4.5%
]
4.45%
2,11398.7%
[
4.5%
-
5.0%
]
4.82%
58194.0%
[
5.0%
-
5.5%
]
5.06%
15895.9%
[
5.0%
-
5.5%
]
5.33%
58292.8%
[
5.5%
-
6.0%
]
5.60%
5,71197.6%
[
6.0%
-
6.5%
]
6.28%
2,35799.2%
[
6.5%
-
7.0%
]
6.95%
56199.4%
[
7.0%
-
7.5%
]
7.05%
22782.1%
[
7.5%
-
8.0%
]
7.82%
1,01083.1%
[
7.5%
-
8.0%
]
7.97%
251100.0%
[
8.5%
-
9.0%
]
8.81%
159100.0%
[
9.0%
-
9.5%
]
9.26%
1,36094.2%
[
10.0%
-
10.5%
]
10.27%
2,44396.6%
[
10.5%
-
11.0%
]
10.79%
278100.0%
[
12.5%
-
13.0%
]
12.82%
19598.1%
[
13.0%
-
13.5%
]
13.40%
20999.0%
[
14.0%
-
14.5%
]
14.29%
35100.0%
[
15.0%
-
15.5%
]
15.00%
20100.0%
[
15.5%
-
16.0%
]
15.51%
18798.5%
[
16.5%
-
17.0%
]
16.57%
175100.0%
[
17.5%
-
18.0%
]
17.61%
35297.2%
[
20.5%
-
21.0%
]
20.90%
244100.0%
[
22.5%
-
23.0%
]
22.80%
53594.3%
[
23.0%
-
23.5%
]
23.39%
218100.0%
[
27.0%
-
27.5%
]
27.37%
17993.2%
[
31.0%
-
31.5%
]
31.48%
953100.0%
[
40.5%
-
41.0%
]
40.91%
154100.0%
[
46.0%
-
46.5%
]
46.15%
39100.0%
[
49.0%
-
49.5%
]
49.34%
227100.0%
[
58.0%
-
58.5%
]
58.33%
60100.0%