Immigrants from Thailand 1 or more Vehicles in Household
COMPARE
Immigrants from Thailand
Select to Compare
1 or more Vehicles in Household
Immigrants from Thailand 1 or more Vehicles in Household
90.6%
1+ VEHICLES AVAILABLE
92.3/ 100
METRIC RATING
120th/ 347
METRIC RANK
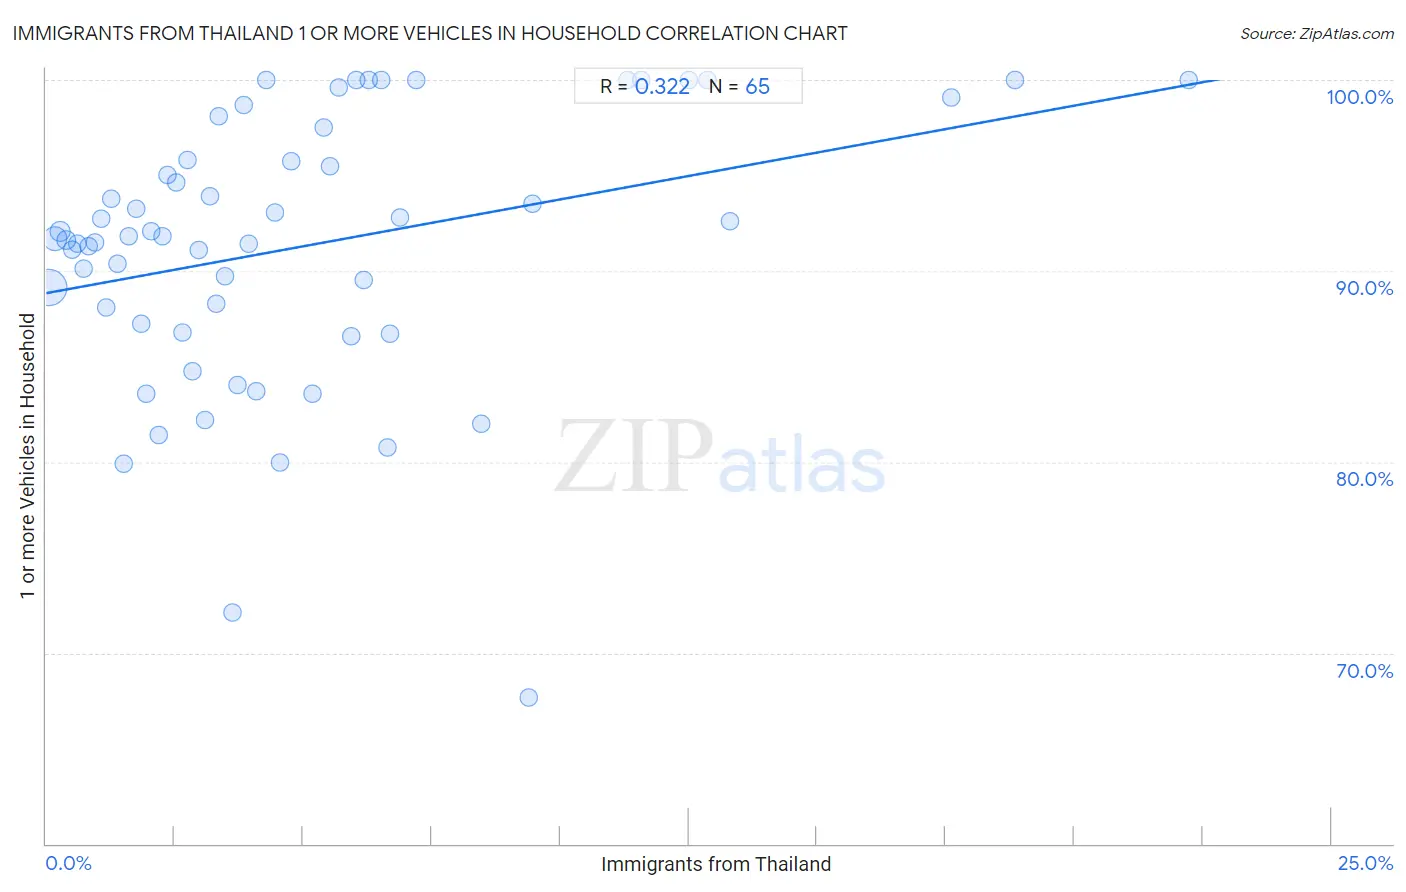
Immigrants from Thailand 1 or more Vehicles in Household Correlation Chart
The statistical analysis conducted on geographies consisting of 316,939,946 people shows a mild positive correlation between the proportion of Immigrants from Thailand and percentage of households with 1 or more vehicles available in the United States with a correlation coefficient (R) of 0.322 and weighted average of 90.6%. On average, for every 1% (one percent) increase in Immigrants from Thailand within a typical geography, there is an increase of 0.49% in percentage of households with 1 or more vehicles available.
It is essential to understand that the correlation between the percentage of Immigrants from Thailand and percentage of households with 1 or more vehicles available does not imply a direct cause-and-effect relationship. It remains uncertain whether the presence of Immigrants from Thailand influences an upward or downward trend in the level of percentage of households with 1 or more vehicles available within an area, or if Immigrants from Thailand simply ended up residing in those areas with higher or lower levels of percentage of households with 1 or more vehicles available due to other factors.
Demographics Similar to Immigrants from Thailand by 1 or more Vehicles in Household
In terms of 1 or more vehicles in household, the demographic groups most similar to Immigrants from Thailand are Icelander (90.5%, a difference of 0.010%), Blackfeet (90.6%, a difference of 0.020%), Costa Rican (90.5%, a difference of 0.020%), Fijian (90.5%, a difference of 0.020%), and Puget Sound Salish (90.5%, a difference of 0.040%).
| Demographics | Rating | Rank | 1 or more Vehicles in Household |
| Immigrants from Kuwait | 94.7 /100 | #113 | Exceptional 90.7% |
| Armenians | 94.5 /100 | #114 | Exceptional 90.7% |
| Serbians | 94.3 /100 | #115 | Exceptional 90.7% |
| Chippewa | 94.3 /100 | #116 | Exceptional 90.7% |
| Greeks | 93.5 /100 | #117 | Exceptional 90.6% |
| Japanese | 93.4 /100 | #118 | Exceptional 90.6% |
| Blackfeet | 92.6 /100 | #119 | Exceptional 90.6% |
| Immigrants from Thailand | 92.3 /100 | #120 | Exceptional 90.6% |
| Icelanders | 92.1 /100 | #121 | Exceptional 90.5% |
| Costa Ricans | 92.0 /100 | #122 | Exceptional 90.5% |
| Fijians | 91.8 /100 | #123 | Exceptional 90.5% |
| Puget Sound Salish | 91.5 /100 | #124 | Exceptional 90.5% |
| Immigrants from Korea | 90.5 /100 | #125 | Exceptional 90.5% |
| Immigrants from Cameroon | 89.4 /100 | #126 | Excellent 90.4% |
| Immigrants from the Azores | 89.1 /100 | #127 | Excellent 90.4% |
Immigrants from Thailand 1 or more Vehicles in Household Correlation Summary
| Measurement | Immigrants from Thailand Data | 1 or more Vehicles in Household Data |
| Minimum | 0.054% | 67.6% |
| Maximum | 22.2% | 100.0% |
| Range | 22.2% | 32.4% |
| Mean | 5.0% | 91.3% |
| Median | 3.6% | 91.8% |
| Interquartile 25% (IQ1) | 1.8% | 87.0% |
| Interquartile 75% (IQ3) | 6.4% | 96.7% |
| Interquartile Range (IQR) | 4.6% | 9.6% |
| Standard Deviation (Sample) | 4.6% | 7.0% |
| Standard Deviation (Population) | 4.6% | 7.0% |
Correlation Details
| Immigrants from Thailand Percentile | Sample Size | 1 or more Vehicles in Household |
[ 0.0% - 0.5% ] 0.054% | 196,967,806 | 89.1% |
[ 0.0% - 0.5% ] 0.16% | 66,522,254 | 91.7% |
[ 0.0% - 0.5% ] 0.27% | 23,654,623 | 92.1% |
[ 0.0% - 0.5% ] 0.38% | 11,969,017 | 91.6% |
[ 0.0% - 0.5% ] 0.50% | 6,068,743 | 91.1% |
[ 0.5% - 1.0% ] 0.61% | 3,124,618 | 91.4% |
[ 0.5% - 1.0% ] 0.72% | 2,376,855 | 90.1% |
[ 0.5% - 1.0% ] 0.83% | 1,154,456 | 91.3% |
[ 0.5% - 1.0% ] 0.94% | 684,903 | 91.5% |
[ 1.0% - 1.5% ] 1.06% | 833,117 | 92.7% |
[ 1.0% - 1.5% ] 1.16% | 473,993 | 88.1% |
[ 1.0% - 1.5% ] 1.27% | 358,573 | 93.8% |
[ 1.0% - 1.5% ] 1.39% | 519,302 | 90.4% |
[ 1.5% - 2.0% ] 1.51% | 439,683 | 79.9% |
[ 1.5% - 2.0% ] 1.61% | 197,779 | 91.8% |
[ 1.5% - 2.0% ] 1.76% | 249,880 | 93.3% |
[ 1.5% - 2.0% ] 1.84% | 109,699 | 87.2% |
[ 1.5% - 2.0% ] 1.95% | 76,754 | 83.6% |
[ 2.0% - 2.5% ] 2.04% | 165,531 | 92.1% |
[ 2.0% - 2.5% ] 2.19% | 124,686 | 81.4% |
[ 2.0% - 2.5% ] 2.27% | 87,426 | 91.8% |
[ 2.0% - 2.5% ] 2.35% | 18,735 | 95.0% |
[ 2.5% - 3.0% ] 2.52% | 18,268 | 94.6% |
[ 2.5% - 3.0% ] 2.65% | 317,962 | 86.8% |
[ 2.5% - 3.0% ] 2.75% | 23,718 | 95.8% |
[ 2.5% - 3.0% ] 2.85% | 47,949 | 84.7% |
[ 2.5% - 3.0% ] 2.97% | 61,569 | 91.1% |
[ 3.0% - 3.5% ] 3.08% | 45,062 | 82.2% |
[ 3.0% - 3.5% ] 3.18% | 1,414 | 93.9% |
[ 3.0% - 3.5% ] 3.30% | 16,289 | 88.3% |
[ 3.0% - 3.5% ] 3.37% | 2,584 | 98.1% |
[ 3.0% - 3.5% ] 3.49% | 85,478 | 89.7% |
[ 3.5% - 4.0% ] 3.63% | 17,681 | 72.1% |
[ 3.5% - 4.0% ] 3.71% | 6,065 | 84.0% |
[ 3.5% - 4.0% ] 3.83% | 3,496 | 98.7% |
[ 3.5% - 4.0% ] 3.95% | 380 | 91.4% |
[ 4.0% - 4.5% ] 4.08% | 834 | 83.7% |
[ 4.0% - 4.5% ] 4.27% | 468 | 100.0% |
[ 4.0% - 4.5% ] 4.44% | 540 | 93.1% |
[ 4.5% - 5.0% ] 4.55% | 88 | 80.0% |
[ 4.5% - 5.0% ] 4.76% | 987 | 95.8% |
[ 5.0% - 5.5% ] 5.19% | 289 | 83.6% |
[ 5.0% - 5.5% ] 5.41% | 296 | 97.5% |
[ 5.5% - 6.0% ] 5.51% | 399 | 95.5% |
[ 5.5% - 6.0% ] 5.69% | 879 | 99.6% |
[ 5.5% - 6.0% ] 5.93% | 58,959 | 86.5% |
[ 6.0% - 6.5% ] 6.03% | 564 | 100.0% |
[ 6.0% - 6.5% ] 6.18% | 1,035 | 89.5% |
[ 6.0% - 6.5% ] 6.28% | 557 | 100.0% |
[ 6.5% - 7.0% ] 6.51% | 1,045 | 100.0% |
[ 6.5% - 7.0% ] 6.63% | 19,613 | 80.7% |
[ 6.5% - 7.0% ] 6.70% | 19,501 | 86.7% |
[ 6.5% - 7.0% ] 6.87% | 262 | 92.8% |
[ 7.0% - 7.5% ] 7.20% | 2,332 | 100.0% |
[ 8.0% - 8.5% ] 8.47% | 177 | 82.0% |
[ 9.0% - 9.5% ] 9.38% | 96 | 67.6% |
[ 9.0% - 9.5% ] 9.47% | 1,035 | 93.5% |
[ 11.0% - 11.5% ] 11.30% | 478 | 100.0% |
[ 11.5% - 12.0% ] 11.57% | 1,132 | 100.0% |
[ 12.0% - 12.5% ] 12.50% | 32 | 100.0% |
[ 12.5% - 13.0% ] 12.87% | 404 | 100.0% |
[ 13.0% - 13.5% ] 13.29% | 948 | 92.6% |
[ 17.5% - 18.0% ] 17.62% | 403 | 99.1% |
[ 18.5% - 19.0% ] 18.85% | 191 | 100.0% |
[ 22.0% - 22.5% ] 22.22% | 54 | 100.0% |