Somali 1 or more Vehicles in Household
COMPARE
Somali
Select to Compare
1 or more Vehicles in Household
Somali 1 or more Vehicles in Household
89.0%
1+ VEHICLES AVAILABLE
12.8/ 100
METRIC RATING
212th/ 347
METRIC RANK
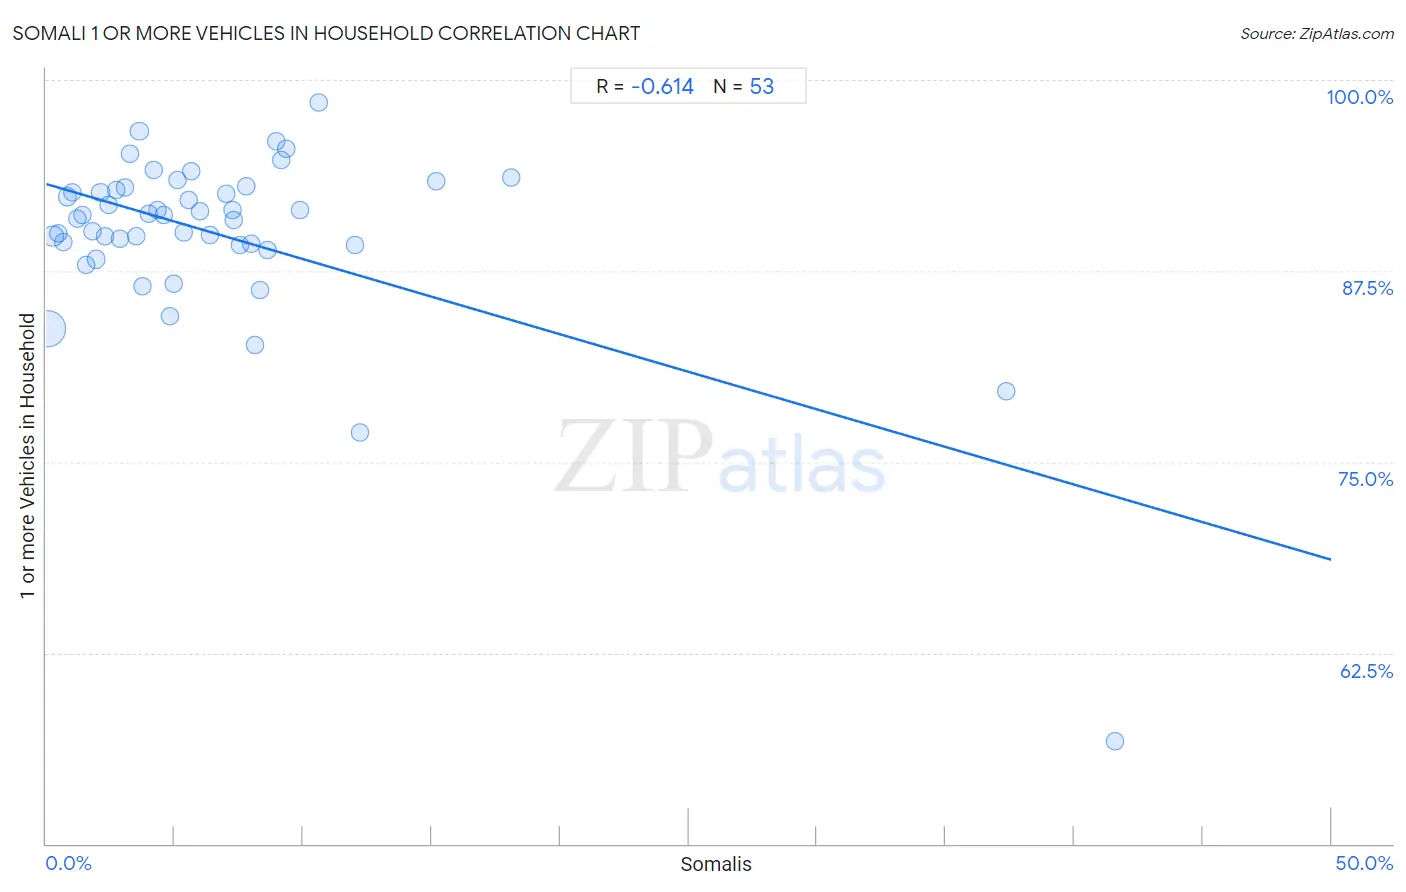
Somali 1 or more Vehicles in Household Correlation Chart
The statistical analysis conducted on geographies consisting of 99,266,005 people shows a significant negative correlation between the proportion of Somalis and percentage of households with 1 or more vehicles available in the United States with a correlation coefficient (R) of -0.614 and weighted average of 89.0%. On average, for every 1% (one percent) increase in Somalis within a typical geography, there is a decrease of 0.49% in percentage of households with 1 or more vehicles available.
It is essential to understand that the correlation between the percentage of Somalis and percentage of households with 1 or more vehicles available does not imply a direct cause-and-effect relationship. It remains uncertain whether the presence of Somalis influences an upward or downward trend in the level of percentage of households with 1 or more vehicles available within an area, or if Somalis simply ended up residing in those areas with higher or lower levels of percentage of households with 1 or more vehicles available due to other factors.
Demographics Similar to Somalis by 1 or more Vehicles in Household
In terms of 1 or more vehicles in household, the demographic groups most similar to Somalis are Sierra Leonean (89.0%, a difference of 0.010%), Immigrants from Western Asia (89.0%, a difference of 0.020%), Dutch West Indian (89.0%, a difference of 0.030%), Immigrants from Hungary (89.0%, a difference of 0.030%), and Immigrants from Italy (89.1%, a difference of 0.040%).
| Demographics | Rating | Rank | 1 or more Vehicles in Household |
| Guatemalans | 17.8 /100 | #205 | Poor 89.2% |
| Apache | 16.2 /100 | #206 | Poor 89.1% |
| Immigrants from Denmark | 14.8 /100 | #207 | Poor 89.1% |
| Immigrants from Chile | 14.4 /100 | #208 | Poor 89.1% |
| Immigrants from Italy | 14.0 /100 | #209 | Poor 89.1% |
| Dutch West Indians | 13.5 /100 | #210 | Poor 89.0% |
| Sierra Leoneans | 13.0 /100 | #211 | Poor 89.0% |
| Somalis | 12.8 /100 | #212 | Poor 89.0% |
| Immigrants from Western Asia | 12.3 /100 | #213 | Poor 89.0% |
| Immigrants from Hungary | 11.9 /100 | #214 | Poor 89.0% |
| Immigrants from Sri Lanka | 10.2 /100 | #215 | Poor 88.9% |
| Immigrants from Argentina | 9.4 /100 | #216 | Tragic 88.9% |
| Argentineans | 8.8 /100 | #217 | Tragic 88.9% |
| Ugandans | 8.7 /100 | #218 | Tragic 88.9% |
| Immigrants from Guatemala | 8.6 /100 | #219 | Tragic 88.9% |
Somali 1 or more Vehicles in Household Correlation Summary
| Measurement | Somali Data | 1 or more Vehicles in Household Data |
| Minimum | 0.041% | 56.7% |
| Maximum | 41.6% | 98.6% |
| Range | 41.5% | 41.9% |
| Mean | 6.7% | 89.9% |
| Median | 4.9% | 91.2% |
| Interquartile 25% (IQ1) | 2.4% | 89.2% |
| Interquartile 75% (IQ3) | 8.2% | 92.9% |
| Interquartile Range (IQR) | 5.8% | 3.7% |
| Standard Deviation (Sample) | 7.6% | 6.1% |
| Standard Deviation (Population) | 7.5% | 6.0% |
Correlation Details
| Somali Percentile | Sample Size | 1 or more Vehicles in Household |
[ 0.0% - 0.5% ] 0.041% | 72,714,347 | 83.7% |
[ 0.0% - 0.5% ] 0.26% | 10,918,541 | 89.8% |
[ 0.0% - 0.5% ] 0.47% | 3,161,309 | 90.0% |
[ 0.5% - 1.0% ] 0.66% | 3,143,096 | 89.4% |
[ 0.5% - 1.0% ] 0.82% | 1,266,200 | 92.4% |
[ 1.0% - 1.5% ] 1.04% | 1,007,768 | 92.6% |
[ 1.0% - 1.5% ] 1.20% | 1,110,250 | 90.9% |
[ 1.0% - 1.5% ] 1.40% | 449,700 | 91.2% |
[ 1.5% - 2.0% ] 1.57% | 659,255 | 87.9% |
[ 1.5% - 2.0% ] 1.78% | 187,013 | 90.1% |
[ 1.5% - 2.0% ] 1.95% | 580,421 | 88.3% |
[ 2.0% - 2.5% ] 2.11% | 250,869 | 92.6% |
[ 2.0% - 2.5% ] 2.28% | 145,273 | 89.8% |
[ 2.0% - 2.5% ] 2.44% | 970,275 | 91.8% |
[ 2.5% - 3.0% ] 2.72% | 220,129 | 92.8% |
[ 2.5% - 3.0% ] 2.86% | 236,661 | 89.6% |
[ 3.0% - 3.5% ] 3.06% | 186,812 | 93.0% |
[ 3.0% - 3.5% ] 3.24% | 143,512 | 95.2% |
[ 3.5% - 4.0% ] 3.51% | 172,840 | 89.8% |
[ 3.5% - 4.0% ] 3.62% | 104,916 | 96.7% |
[ 3.5% - 4.0% ] 3.74% | 17,641 | 86.5% |
[ 3.5% - 4.0% ] 3.99% | 205,658 | 91.2% |
[ 4.0% - 4.5% ] 4.17% | 3,548 | 94.1% |
[ 4.0% - 4.5% ] 4.33% | 54,028 | 91.5% |
[ 4.5% - 5.0% ] 4.58% | 21,569 | 91.2% |
[ 4.5% - 5.0% ] 4.80% | 510,556 | 84.6% |
[ 4.5% - 5.0% ] 4.95% | 122,965 | 86.6% |
[ 5.0% - 5.5% ] 5.11% | 17,532 | 93.4% |
[ 5.0% - 5.5% ] 5.36% | 30,641 | 90.0% |
[ 5.5% - 6.0% ] 5.57% | 88,768 | 92.2% |
[ 5.5% - 6.0% ] 5.65% | 177 | 94.0% |
[ 5.5% - 6.0% ] 5.97% | 23,433 | 91.4% |
[ 6.0% - 6.5% ] 6.37% | 68,910 | 89.8% |
[ 7.0% - 7.5% ] 7.01% | 67,999 | 92.6% |
[ 7.0% - 7.5% ] 7.23% | 42,581 | 91.5% |
[ 7.0% - 7.5% ] 7.31% | 26,760 | 90.9% |
[ 7.5% - 8.0% ] 7.53% | 32,681 | 89.2% |
[ 7.5% - 8.0% ] 7.77% | 30,973 | 93.1% |
[ 7.5% - 8.0% ] 7.98% | 61,423 | 89.3% |
[ 8.0% - 8.5% ] 8.11% | 14,746 | 82.7% |
[ 8.0% - 8.5% ] 8.30% | 24,067 | 86.2% |
[ 8.5% - 9.0% ] 8.63% | 22,827 | 88.9% |
[ 8.5% - 9.0% ] 8.95% | 14,759 | 96.0% |
[ 9.0% - 9.5% ] 9.13% | 23,110 | 94.7% |
[ 9.0% - 9.5% ] 9.36% | 5,984 | 95.5% |
[ 9.5% - 10.0% ] 9.85% | 24,418 | 91.4% |
[ 10.5% - 11.0% ] 10.62% | 631 | 98.6% |
[ 12.0% - 12.5% ] 12.03% | 32,136 | 89.2% |
[ 12.0% - 12.5% ] 12.22% | 30,625 | 76.9% |
[ 15.0% - 15.5% ] 15.16% | 3,693 | 93.4% |
[ 18.0% - 18.5% ] 18.08% | 1,930 | 93.6% |
[ 37.0% - 37.5% ] 37.34% | 1,157 | 79.6% |
[ 41.5% - 42.0% ] 41.59% | 8,892 | 56.7% |