Houma 1 or more Vehicles in Household
COMPARE
Houma
Select to Compare
1 or more Vehicles in Household
Houma 1 or more Vehicles in Household
88.6%
1+ VEHICLES AVAILABLE
4.8/ 100
METRIC RATING
233rd/ 347
METRIC RANK
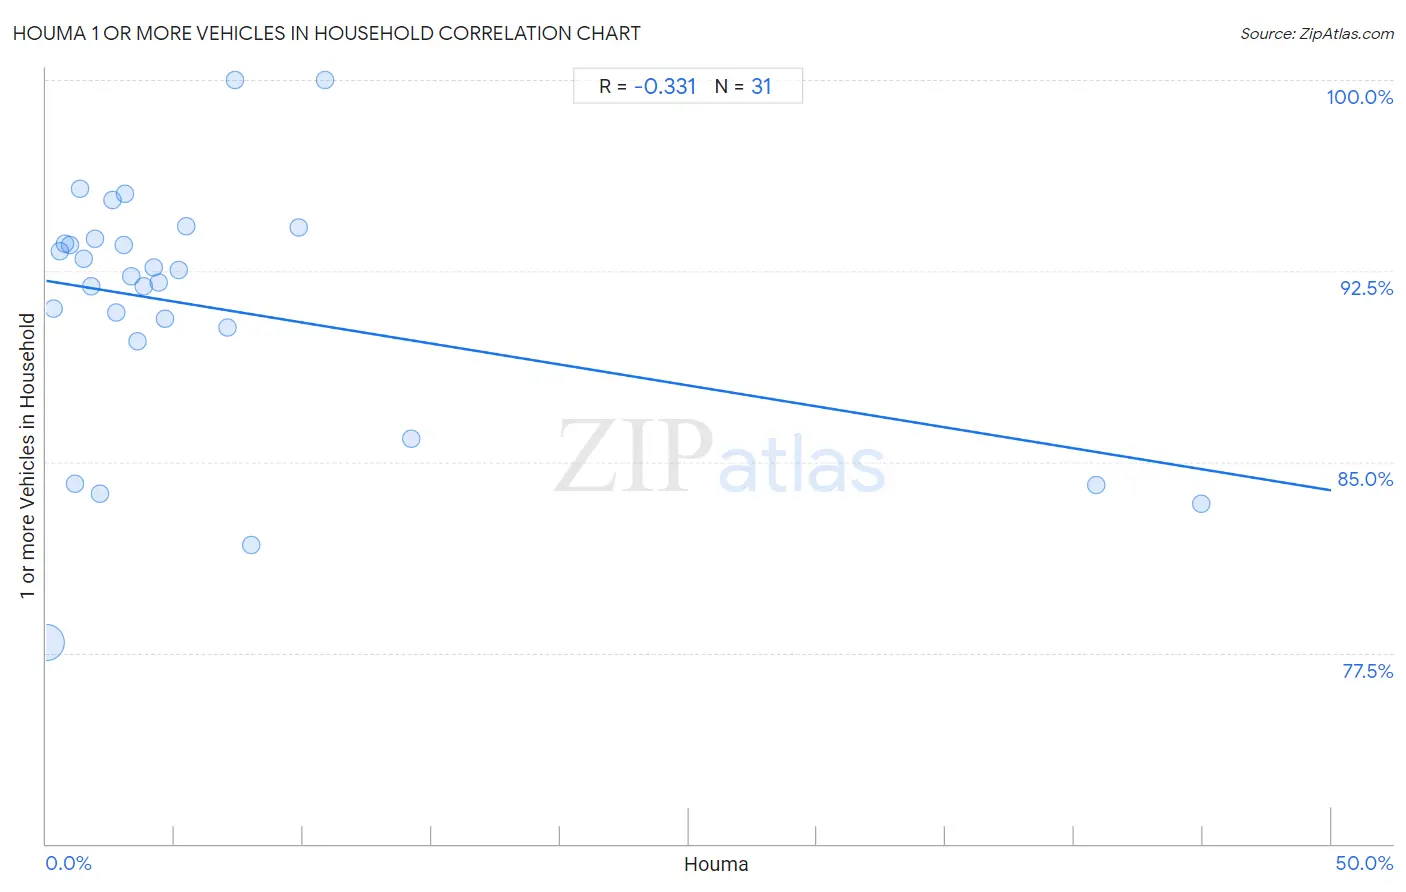
Houma 1 or more Vehicles in Household Correlation Chart
The statistical analysis conducted on geographies consisting of 36,796,778 people shows a mild negative correlation between the proportion of Houma and percentage of households with 1 or more vehicles available in the United States with a correlation coefficient (R) of -0.331 and weighted average of 88.6%. On average, for every 1% (one percent) increase in Houma within a typical geography, there is a decrease of 0.16% in percentage of households with 1 or more vehicles available.
It is essential to understand that the correlation between the percentage of Houma and percentage of households with 1 or more vehicles available does not imply a direct cause-and-effect relationship. It remains uncertain whether the presence of Houma influences an upward or downward trend in the level of percentage of households with 1 or more vehicles available within an area, or if Houma simply ended up residing in those areas with higher or lower levels of percentage of households with 1 or more vehicles available due to other factors.
Demographics Similar to Houma by 1 or more Vehicles in Household
In terms of 1 or more vehicles in household, the demographic groups most similar to Houma are Immigrants from Japan (88.7%, a difference of 0.010%), Immigrants from Peru (88.6%, a difference of 0.010%), Paiute (88.6%, a difference of 0.010%), Russian (88.7%, a difference of 0.020%), and Immigrants from Pakistan (88.6%, a difference of 0.030%).
| Demographics | Rating | Rank | 1 or more Vehicles in Household |
| Cheyenne | 5.7 /100 | #226 | Tragic 88.7% |
| Ute | 5.6 /100 | #227 | Tragic 88.7% |
| Immigrants from Norway | 5.5 /100 | #228 | Tragic 88.7% |
| Immigrants from Romania | 5.4 /100 | #229 | Tragic 88.7% |
| Immigrants from Sierra Leone | 5.2 /100 | #230 | Tragic 88.7% |
| Russians | 5.0 /100 | #231 | Tragic 88.7% |
| Immigrants from Japan | 4.9 /100 | #232 | Tragic 88.7% |
| Houma | 4.8 /100 | #233 | Tragic 88.6% |
| Immigrants from Peru | 4.7 /100 | #234 | Tragic 88.6% |
| Paiute | 4.6 /100 | #235 | Tragic 88.6% |
| Immigrants from Pakistan | 4.5 /100 | #236 | Tragic 88.6% |
| Immigrants from Turkey | 4.4 /100 | #237 | Tragic 88.6% |
| Immigrants from Somalia | 4.2 /100 | #238 | Tragic 88.6% |
| Kiowa | 3.8 /100 | #239 | Tragic 88.6% |
| Eastern Europeans | 3.0 /100 | #240 | Tragic 88.5% |
Houma 1 or more Vehicles in Household Correlation Summary
| Measurement | Houma Data | 1 or more Vehicles in Household Data |
| Minimum | 0.012% | 77.9% |
| Maximum | 44.9% | 100.0% |
| Range | 44.9% | 22.1% |
| Mean | 6.5% | 91.0% |
| Median | 3.3% | 92.3% |
| Interquartile 25% (IQ1) | 1.5% | 89.7% |
| Interquartile 75% (IQ3) | 7.0% | 93.8% |
| Interquartile Range (IQR) | 5.6% | 4.0% |
| Standard Deviation (Sample) | 10.3% | 5.1% |
| Standard Deviation (Population) | 10.1% | 5.0% |
Correlation Details
| Houma Percentile | Sample Size | 1 or more Vehicles in Household |
[ 0.0% - 0.5% ] 0.012% | 35,258,017 | 77.9% |
[ 0.0% - 0.5% ] 0.28% | 573,737 | 91.0% |
[ 0.5% - 1.0% ] 0.52% | 304,570 | 93.3% |
[ 0.5% - 1.0% ] 0.71% | 264,900 | 93.6% |
[ 0.5% - 1.0% ] 0.93% | 85,949 | 93.5% |
[ 1.0% - 1.5% ] 1.10% | 43,230 | 84.1% |
[ 1.0% - 1.5% ] 1.32% | 4,545 | 95.7% |
[ 1.0% - 1.5% ] 1.47% | 25,087 | 93.0% |
[ 1.5% - 2.0% ] 1.77% | 15,031 | 91.9% |
[ 1.5% - 2.0% ] 1.89% | 11,415 | 93.8% |
[ 2.0% - 2.5% ] 2.09% | 8,600 | 83.7% |
[ 2.5% - 3.0% ] 2.58% | 9,287 | 95.3% |
[ 2.5% - 3.0% ] 2.71% | 7,961 | 90.8% |
[ 2.5% - 3.0% ] 3.00% | 26,788 | 93.5% |
[ 3.0% - 3.5% ] 3.09% | 5,118 | 95.5% |
[ 3.0% - 3.5% ] 3.31% | 5,677 | 92.3% |
[ 3.5% - 4.0% ] 3.56% | 33,094 | 89.7% |
[ 3.5% - 4.0% ] 3.79% | 15,373 | 91.9% |
[ 4.0% - 4.5% ] 4.21% | 11,624 | 92.7% |
[ 4.0% - 4.5% ] 4.40% | 2,386 | 92.0% |
[ 4.5% - 5.0% ] 4.63% | 30,192 | 90.6% |
[ 5.0% - 5.5% ] 5.16% | 35,760 | 92.6% |
[ 5.0% - 5.5% ] 5.46% | 5,845 | 94.3% |
[ 7.0% - 7.5% ] 7.04% | 3,762 | 90.3% |
[ 7.0% - 7.5% ] 7.34% | 286 | 100.0% |
[ 7.5% - 8.0% ] 7.99% | 2,880 | 81.8% |
[ 9.5% - 10.0% ] 9.84% | 2,511 | 94.2% |
[ 10.5% - 11.0% ] 10.82% | 194 | 100.0% |
[ 14.0% - 14.5% ] 14.18% | 1,347 | 85.9% |
[ 40.5% - 41.0% ] 40.88% | 844 | 84.1% |
[ 44.5% - 45.0% ] 44.92% | 768 | 83.3% |