Immigrants from Germany 1 or more Vehicles in Household

COMPARE

Immigrants from Germany
Race
Ancestry
AfghanAfricanAlaska NativeAlaskan AthabascanAlbanianAleutAlsatianAmericanApacheArabArapahoArgentineanArmenianAssyrian/Chaldean/SyriacAustralianAustrianBahamianBangladeshiBarbadianBasqueBelgianBelizeanBermudanBhutaneseBlackfeetBolivianBrazilianBritishBritish West IndianBulgarianBurmeseCajunCambodianCanadianCape VerdeanCarpatho RusynCelticCentral AmericanCentral American IndianCherokeeCheyenneChickasawChileanChineseChippewaChoctawColombianColvilleComancheCosta RicanCreeCreekCroatianCrowCubanCypriotCzechCzechoslovakianDanishDelawareDominicanDutchDutch West IndianEastern EuropeanEcuadorianEgyptianEnglishEstonianEthiopianEuropeanFijianFilipinoFinnishFrenchFrench American IndianFrench CanadianGermanGerman RussianGhanaianGreekGuamanian/ChamorroGuatemalanGuyaneseHaitianHmongHonduranHopiHoumaHungarianIcelanderIndian (Asian)IndonesianInupiatIranianIraqiIrishIroquoisIsraeliItalianJamaicanJapaneseJordanianKenyanKiowaKoreanLaotianLatvianLebaneseLiberianLithuanianLumbeeLuxembourgerMacedonianMalaysianMalteseMarshalleseMenomineeMexicanMexican American IndianMongolianMoroccanNative HawaiianNavajoNepaleseNew ZealanderNicaraguanNigerianNorthern EuropeanNorwegianOkinawanOsageOttawaPaiutePakistaniPalestinianPanamanianParaguayanPennsylvania GermanPeruvianPimaPolishPortuguesePotawatomiPuebloPuerto RicanPuget Sound SalishRomanianRussianSalvadoranSamoanScandinavianScotch-IrishScottishSeminoleSenegaleseSerbianShoshoneSierra LeoneanSiouxSlavicSlovakSloveneSomaliSouth AfricanSouth AmericanSouth American IndianSoviet UnionSpaniardSpanishSpanish AmericanSpanish American IndianSri LankanSubsaharan AfricanSudaneseSwedishSwissSyrianTaiwaneseThaiTlingit-HaidaTohono O'OdhamTonganTrinidadian and TobagonianTsimshianTurkishU.S. Virgin IslanderUgandanUkrainianUruguayanUteVenezuelanVietnameseWelshWest IndianYakamaYaquiYugoslavianYumanYup'ikZimbabwean
Immigration
NonimmigrantsImmigrantsAfghanistanAfricaAlbaniaArgentinaArmeniaAsiaAustraliaAustriaBahamasBangladeshBarbadosBelarusBelgiumBelizeBoliviaBosnia and HerzegovinaBrazilBulgariaBurma/MyanmarCabo VerdeCambodiaCameroonCanadaCaribbeanCentral AmericaChileChinaColombiaCongoCosta RicaCroatiaCubaCzechoslovakiaDenmarkDominicaDominican RepublicEastern AfricaEastern AsiaEastern EuropeEcuadorEgyptEl SalvadorEnglandEritreaEthiopiaEuropeFijiFranceGermanyGhanaGreeceGrenadaGuatemalaGuyanaHaitiHondurasHong KongHungaryIndiaIndonesiaIranIraqIrelandIsraelItalyJamaicaJapanJordanKazakhstanKenyaKoreaKuwaitLaosLatin AmericaLatviaLebanonLiberiaLithuaniaMalaysiaMexicoMicronesiaMiddle AfricaMoldovaMoroccoNepalNetherlandsNicaraguaNigeriaNorth AmericaNorth MacedoniaNorthern AfricaNorthern EuropeNorwayOceaniaPakistanPanamaPeruPhilippinesPolandPortugalRomaniaRussiaSaudi ArabiaScotlandSenegalSerbiaSierra LeoneSingaporeSomaliaSouth AfricaSouth AmericaSouth Central AsiaSouth Eastern AsiaSouthern EuropeSpainSri LankaSt. Vincent and the GrenadinesSudanSwedenSwitzerlandSyriaTaiwanThailandTrinidad and TobagoTurkeyUgandaUkraineUruguayUzbekistanVenezuelaVietnamWest IndiesWestern AfricaWestern AsiaWestern EuropeYemenZaireZimbabweAzores
Select to Compare
Race
Ancestry
AfghanAfricanAlaska NativeAlaskan AthabascanAlbanianAleutAlsatianAmericanApacheArabArapahoArgentineanArmenianAssyrian/Chaldean/SyriacAustralianAustrianBahamianBangladeshiBarbadianBasqueBelgianBelizeanBermudanBhutaneseBlackfeetBolivianBrazilianBritishBritish West IndianBulgarianBurmeseCajunCambodianCanadianCape VerdeanCarpatho RusynCelticCentral AmericanCentral American IndianCherokeeCheyenneChickasawChileanChineseChippewaChoctawColombianColvilleComancheCosta RicanCreeCreekCroatianCrowCubanCypriotCzechCzechoslovakianDanishDelawareDominicanDutchDutch West IndianEastern EuropeanEcuadorianEgyptianEnglishEstonianEthiopianEuropeanFijianFilipinoFinnishFrenchFrench American IndianFrench CanadianGermanGerman RussianGhanaianGreekGuamanian/ChamorroGuatemalanGuyaneseHaitianHmongHonduranHopiHoumaHungarianIcelanderIndian (Asian)IndonesianInupiatIranianIraqiIrishIroquoisIsraeliItalianJamaicanJapaneseJordanianKenyanKiowaKoreanLaotianLatvianLebaneseLiberianLithuanianLumbeeLuxembourgerMacedonianMalaysianMalteseMarshalleseMenomineeMexicanMexican American IndianMongolianMoroccanNative HawaiianNavajoNepaleseNew ZealanderNicaraguanNigerianNorthern EuropeanNorwegianOkinawanOsageOttawaPaiutePakistaniPalestinianPanamanianParaguayanPennsylvania GermanPeruvianPimaPolishPortuguesePotawatomiPuebloPuerto RicanPuget Sound SalishRomanianRussianSalvadoranSamoanScandinavianScotch-IrishScottishSeminoleSenegaleseSerbianShoshoneSierra LeoneanSiouxSlavicSlovakSloveneSomaliSouth AfricanSouth AmericanSouth American IndianSoviet UnionSpaniardSpanishSpanish AmericanSpanish American IndianSri LankanSubsaharan AfricanSudaneseSwedishSwissSyrianTaiwaneseThaiTlingit-HaidaTohono O'OdhamTonganTrinidadian and TobagonianTsimshianTurkishU.S. Virgin IslanderUgandanUkrainianUruguayanUteVenezuelanVietnameseWelshWest IndianYakamaYaquiYugoslavianYumanYup'ikZimbabwean
Immigration
NonimmigrantsImmigrantsAfghanistanAfricaAlbaniaArgentinaArmeniaAsiaAustraliaAustriaBahamasBangladeshBarbadosBelarusBelgiumBelizeBoliviaBosnia and HerzegovinaBrazilBulgariaBurma/MyanmarCabo VerdeCambodiaCameroonCanadaCaribbeanCentral AmericaChileChinaColombiaCongoCosta RicaCroatiaCubaCzechoslovakiaDenmarkDominicaDominican RepublicEastern AfricaEastern AsiaEastern EuropeEcuadorEgyptEl SalvadorEnglandEritreaEthiopiaEuropeFijiFranceGhanaGreeceGrenadaGuatemalaGuyanaHaitiHondurasHong KongHungaryIndiaIndonesiaIranIraqIrelandIsraelItalyJamaicaJapanJordanKazakhstanKenyaKoreaKuwaitLaosLatin AmericaLatviaLebanonLiberiaLithuaniaMalaysiaMexicoMicronesiaMiddle AfricaMoldovaMoroccoNepalNetherlandsNicaraguaNigeriaNorth AmericaNorth MacedoniaNorthern AfricaNorthern EuropeNorwayOceaniaPakistanPanamaPeruPhilippinesPolandPortugalRomaniaRussiaSaudi ArabiaScotlandSenegalSerbiaSierra LeoneSingaporeSomaliaSouth AfricaSouth AmericaSouth Central AsiaSouth Eastern AsiaSouthern EuropeSpainSri LankaSt. Vincent and the GrenadinesSudanSwedenSwitzerlandSyriaTaiwanThailandTrinidad and TobagoTurkeyUgandaUkraineUruguayUzbekistanVenezuelaVietnamWest IndiesWestern AfricaWestern AsiaWestern EuropeYemenZaireZimbabweAzores
1 or more Vehicles in Household
Income
Poverty
Unemployment
Labor Participation
Family Structure
Vehicle Availability
Education Level
Disability

Immigrants from Germany 1 or more Vehicles in Household
Exceptional

91.4%
1+ VEHICLES AVAILABLE
99.2/ 100
METRIC RATING
87th/ 347
METRIC RANK

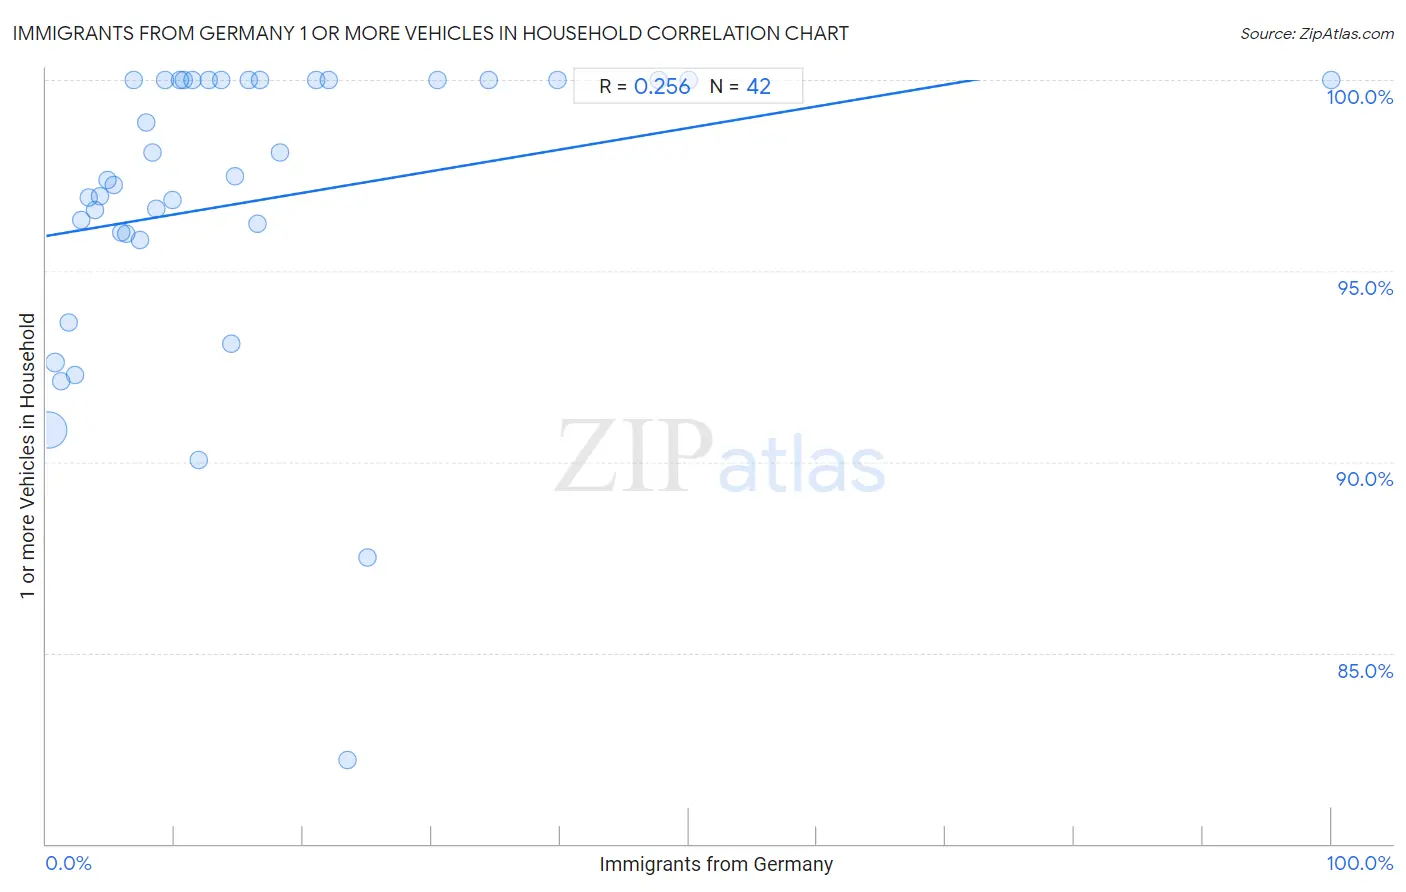
Immigrants from Germany 1 or more Vehicles in Household Correlation Chart

The statistical analysis conducted on geographies consisting of 463,788,940 people shows a weak positive correlation between the proportion of Immigrants from Germany and percentage of households with 1 or more vehicles available in the United States with a correlation coefficient (R) of 0.256 and weighted average of 91.4%. On average, for every 1% (one percent) increase in Immigrants from Germany within a typical geography, there is an increase of 0.057% in percentage of households with 1 or more vehicles available.
Immigrants from Germany 1 or more Vehicles in Household
It is essential to understand that the correlation between the percentage of Immigrants from Germany and percentage of households with 1 or more vehicles available does not imply a direct cause-and-effect relationship. It remains uncertain whether the presence of Immigrants from Germany influences an upward or downward trend in the level of percentage of households with 1 or more vehicles available within an area, or if Immigrants from Germany simply ended up residing in those areas with higher or lower levels of percentage of households with 1 or more vehicles available due to other factors.

Demographics Similar to Immigrants from Germany by 1 or more Vehicles in Household

In terms of 1 or more vehicles in household, the demographic groups most similar to Immigrants from Germany are Spanish American (91.4%, a difference of 0.0%), Osage (91.4%, a difference of 0.010%), Bangladeshi (91.4%, a difference of 0.010%), Immigrants from Canada (91.4%, a difference of 0.010%), and Immigrants from Jordan (91.4%, a difference of 0.010%).
DemographicsRating | Rank1 or more Vehicles in Household
Bolivians
99.4
/100
|
#80
Exceptional
91.5%
Immigrants from South Eastern Asia
99.3
/100
|
#81
Exceptional
91.4%
Lebanese
99.3
/100
|
#82
Exceptional
91.4%
Immigrants from England
99.3
/100
|
#83
Exceptional
91.4%
Jordanians
99.3
/100
|
#84
Exceptional
91.4%
Tsimshian
99.3
/100
|
#85
Exceptional
91.4%
Osage
99.2
/100
|
#86
Exceptional
91.4%
Immigrants from Germany
99.2
/100
|
#87
Exceptional
91.4%
Spanish Americans
99.2
/100
|
#88
Exceptional
91.4%
Bangladeshis
99.2
/100
|
#89
Exceptional
91.4%
Immigrants from Canada
99.2
/100
|
#90
Exceptional
91.4%
Immigrants from Jordan
99.2
/100
|
#91
Exceptional
91.4%
Bhutanese
99.2
/100
|
#92
Exceptional
91.4%
Immigrants from North America
99.2
/100
|
#93
Exceptional
91.4%
Immigrants from Cuba
99.1
/100
|
#94
Exceptional
91.3%

Immigrants from Germany 1 or more Vehicles in Household Correlation Summary

MeasurementImmigrants from Germany Data1 or more Vehicles in Household Data
Minimum0.16%82.2%
Maximum100.0%100.0%
Range99.8%17.8%
Mean15.7%96.8%
Median10.5%97.4%
Interquartile 25% (IQ1)5.3%96.0%
Interquartile 75% (IQ3)18.2%100.0%
Interquartile Range (IQR)13.0%4.0%
Standard Deviation (Sample)18.0%4.0%
Standard Deviation (Population)17.8%3.9%

Correlation Details

Immigrants from Germany PercentileSample Size1 or more Vehicles in Household
[
0.0%
-
0.5%
]
0.16%
431,495,83990.8%
[
0.5%
-
1.0%
]
0.66%
26,971,69392.6%
[
1.0%
-
1.5%
]
1.19%
3,581,07092.1%
[
1.5%
-
2.0%
]
1.71%
951,09793.6%
[
2.0%
-
2.5%
]
2.21%
350,15092.3%
[
2.5%
-
3.0%
]
2.71%
204,40396.3%
[
3.0%
-
3.5%
]
3.30%
82,46796.9%
[
3.5%
-
4.0%
]
3.80%
30,56396.6%
[
4.0%
-
4.5%
]
4.22%
30,65497.0%
[
4.5%
-
5.0%
]
4.77%
22,66897.4%
[
5.0%
-
5.5%
]
5.26%
22,98797.3%
[
5.5%
-
6.0%
]
5.85%
8,09196.0%
[
6.0%
-
6.5%
]
6.20%
4,46696.0%
[
6.5%
-
7.0%
]
6.82%
2,874100.0%
[
7.0%
-
7.5%
]
7.27%
6,38495.8%
[
7.5%
-
8.0%
]
7.81%
5,71398.9%
[
8.0%
-
8.5%
]
8.26%
2,24098.1%
[
8.5%
-
9.0%
]
8.61%
8,27396.6%
[
9.0%
-
9.5%
]
9.20%
1,033100.0%
[
9.5%
-
10.0%
]
9.78%
31796.9%
[
10.0%
-
10.5%
]
10.42%
1,209100.0%
[
10.5%
-
11.0%
]
10.67%
150100.0%
[
11.0%
-
11.5%
]
11.39%
439100.0%
[
11.5%
-
12.0%
]
11.84%
15290.1%
[
12.5%
-
13.0%
]
12.61%
595100.0%
[
13.5%
-
14.0%
]
13.64%
44100.0%
[
14.0%
-
14.5%
]
14.36%
20293.1%
[
14.5%
-
15.0%
]
14.69%
17797.5%
[
15.5%
-
16.0%
]
15.75%
273100.0%
[
16.0%
-
16.5%
]
16.47%
60796.2%
[
16.5%
-
17.0%
]
16.67%
144100.0%
[
18.0%
-
18.5%
]
18.23%
1,24098.1%
[
21.0%
-
21.5%
]
21.05%
95100.0%
[
21.5%
-
22.0%
]
21.98%
91100.0%
[
23.0%
-
23.5%
]
23.42%
22282.2%
[
25.0%
-
25.5%
]
25.00%
1687.5%
[
30.0%
-
30.5%
]
30.43%
46100.0%
[
34.0%
-
34.5%
]
34.48%
58100.0%
[
39.5%
-
40.0%
]
39.78%
93100.0%
[
47.5%
-
48.0%
]
47.69%
65100.0%
[
50.0%
-
50.5%
]
50.00%
12100.0%
[
99.5%
-
100.0%
]
100.00%
28100.0%