Haitian 1 or more Vehicles in Household
COMPARE
Haitian
Select to Compare
1 or more Vehicles in Household
Haitian 1 or more Vehicles in Household
88.1%
1+ VEHICLES AVAILABLE
0.9/ 100
METRIC RATING
254th/ 347
METRIC RANK
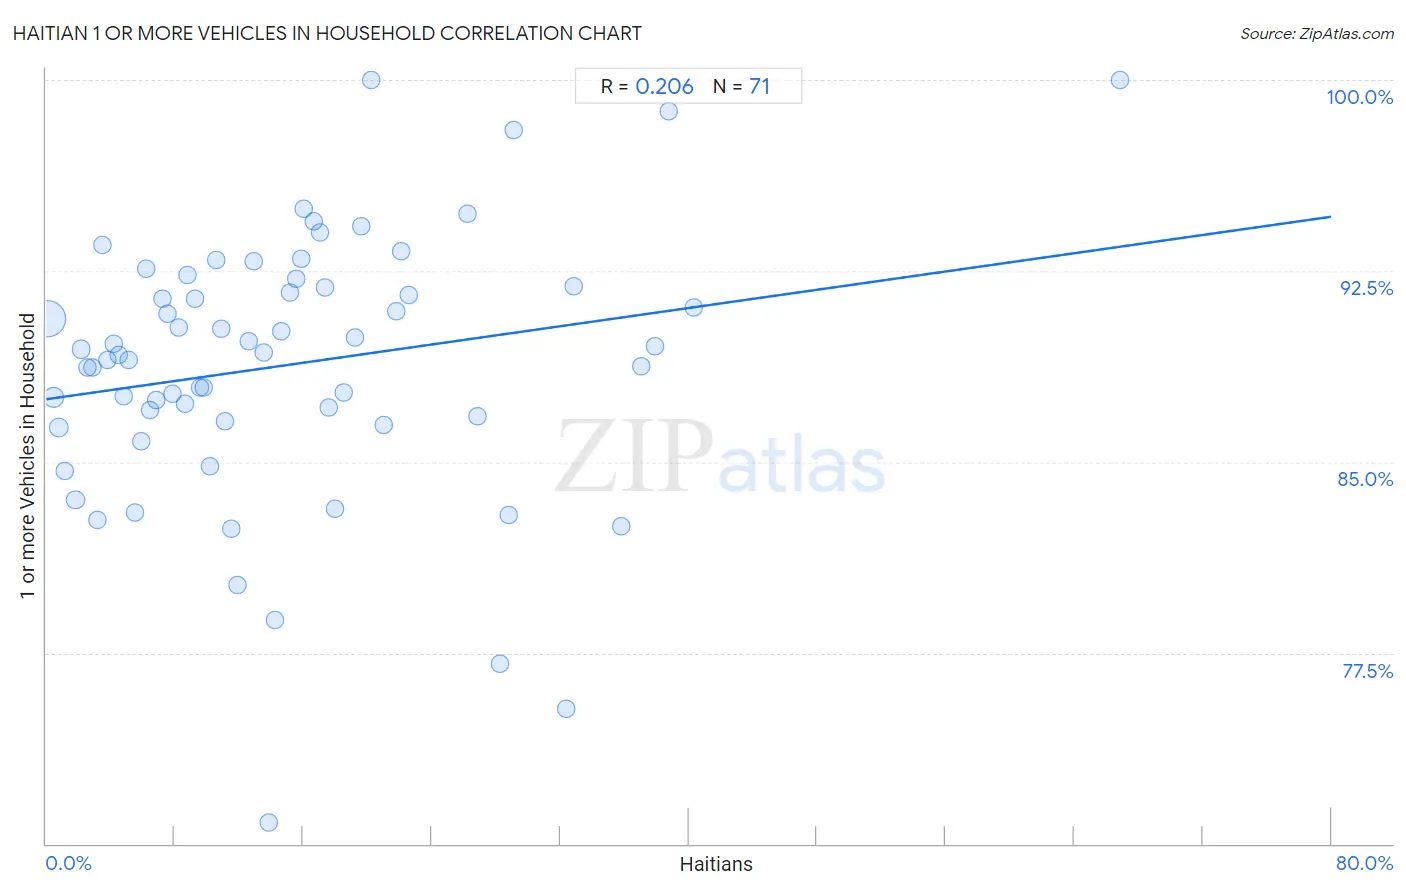
Haitian 1 or more Vehicles in Household Correlation Chart
The statistical analysis conducted on geographies consisting of 275,276,712 people shows a weak positive correlation between the proportion of Haitians and percentage of households with 1 or more vehicles available in the United States with a correlation coefficient (R) of 0.206 and weighted average of 88.1%. On average, for every 1% (one percent) increase in Haitians within a typical geography, there is an increase of 0.090% in percentage of households with 1 or more vehicles available.
It is essential to understand that the correlation between the percentage of Haitians and percentage of households with 1 or more vehicles available does not imply a direct cause-and-effect relationship. It remains uncertain whether the presence of Haitians influences an upward or downward trend in the level of percentage of households with 1 or more vehicles available within an area, or if Haitians simply ended up residing in those areas with higher or lower levels of percentage of households with 1 or more vehicles available due to other factors.
Demographics Similar to Haitians by 1 or more Vehicles in Household
In terms of 1 or more vehicles in household, the demographic groups most similar to Haitians are Honduran (88.1%, a difference of 0.010%), Immigrants from Latvia (88.1%, a difference of 0.020%), Colombian (88.0%, a difference of 0.030%), Liberian (88.0%, a difference of 0.030%), and Immigrants from Uruguay (88.1%, a difference of 0.040%).
| Demographics | Rating | Rank | 1 or more Vehicles in Household |
| Immigrants from Honduras | 1.7 /100 | #247 | Tragic 88.3% |
| Immigrants from Nigeria | 1.5 /100 | #248 | Tragic 88.2% |
| Blacks/African Americans | 1.4 /100 | #249 | Tragic 88.2% |
| Egyptians | 1.2 /100 | #250 | Tragic 88.2% |
| Immigrants from Serbia | 1.2 /100 | #251 | Tragic 88.2% |
| Immigrants from Uruguay | 1.1 /100 | #252 | Tragic 88.1% |
| Hondurans | 1.0 /100 | #253 | Tragic 88.1% |
| Haitians | 0.9 /100 | #254 | Tragic 88.1% |
| Immigrants from Latvia | 0.9 /100 | #255 | Tragic 88.1% |
| Colombians | 0.9 /100 | #256 | Tragic 88.0% |
| Liberians | 0.9 /100 | #257 | Tragic 88.0% |
| South American Indians | 0.9 /100 | #258 | Tragic 88.0% |
| Nigerians | 0.8 /100 | #259 | Tragic 88.0% |
| Macedonians | 0.6 /100 | #260 | Tragic 87.9% |
| Immigrants from Switzerland | 0.6 /100 | #261 | Tragic 87.9% |
Haitian 1 or more Vehicles in Household Correlation Summary
| Measurement | Haitian Data | 1 or more Vehicles in Household Data |
| Minimum | 0.095% | 70.9% |
| Maximum | 66.9% | 100.0% |
| Range | 66.8% | 29.1% |
| Mean | 15.1% | 88.8% |
| Median | 12.6% | 89.3% |
| Interquartile 25% (IQ1) | 6.2% | 86.6% |
| Interquartile 75% (IQ3) | 20.2% | 91.9% |
| Interquartile Range (IQR) | 14.0% | 5.3% |
| Standard Deviation (Sample) | 12.1% | 5.3% |
| Standard Deviation (Population) | 12.0% | 5.2% |
Correlation Details
| Haitian Percentile | Sample Size | 1 or more Vehicles in Household |
[ 0.0% - 0.5% ] 0.095% | 203,720,939 | 90.6% |
[ 0.0% - 0.5% ] 0.48% | 30,013,178 | 87.6% |
[ 0.5% - 1.0% ] 0.81% | 12,936,933 | 86.3% |
[ 1.0% - 1.5% ] 1.15% | 6,768,925 | 84.6% |
[ 1.5% - 2.0% ] 1.83% | 3,042,858 | 83.5% |
[ 2.0% - 2.5% ] 2.15% | 2,369,452 | 89.4% |
[ 2.5% - 3.0% ] 2.53% | 1,393,909 | 88.7% |
[ 2.5% - 3.0% ] 2.84% | 1,306,169 | 88.7% |
[ 3.0% - 3.5% ] 3.16% | 2,349,303 | 82.7% |
[ 3.5% - 4.0% ] 3.52% | 904,461 | 93.5% |
[ 3.5% - 4.0% ] 3.82% | 958,850 | 89.0% |
[ 4.0% - 4.5% ] 4.21% | 334,511 | 89.6% |
[ 4.5% - 5.0% ] 4.53% | 764,205 | 89.2% |
[ 4.5% - 5.0% ] 4.85% | 307,720 | 87.6% |
[ 5.0% - 5.5% ] 5.12% | 757,520 | 89.0% |
[ 5.5% - 6.0% ] 5.50% | 414,815 | 83.0% |
[ 5.5% - 6.0% ] 5.88% | 490,287 | 85.8% |
[ 6.0% - 6.5% ] 6.22% | 706,532 | 92.6% |
[ 6.0% - 6.5% ] 6.47% | 160,947 | 87.0% |
[ 6.5% - 7.0% ] 6.84% | 404,412 | 87.4% |
[ 7.0% - 7.5% ] 7.20% | 215,788 | 91.4% |
[ 7.5% - 8.0% ] 7.51% | 450,380 | 90.8% |
[ 7.5% - 8.0% ] 7.85% | 174,274 | 87.7% |
[ 8.0% - 8.5% ] 8.21% | 576,836 | 90.3% |
[ 8.5% - 9.0% ] 8.60% | 207,256 | 87.3% |
[ 8.5% - 9.0% ] 8.81% | 118,037 | 92.4% |
[ 9.0% - 9.5% ] 9.29% | 188,944 | 91.4% |
[ 9.5% - 10.0% ] 9.57% | 79,212 | 87.9% |
[ 9.5% - 10.0% ] 9.81% | 53,626 | 87.9% |
[ 10.0% - 10.5% ] 10.18% | 375,633 | 84.8% |
[ 10.5% - 11.0% ] 10.62% | 34,935 | 92.9% |
[ 10.5% - 11.0% ] 10.88% | 45,801 | 90.2% |
[ 11.0% - 11.5% ] 11.13% | 72,397 | 86.6% |
[ 11.5% - 12.0% ] 11.55% | 32,311 | 82.4% |
[ 11.5% - 12.0% ] 11.92% | 208,772 | 80.2% |
[ 12.5% - 13.0% ] 12.62% | 98,037 | 89.7% |
[ 12.5% - 13.0% ] 12.90% | 179,860 | 92.9% |
[ 13.5% - 14.0% ] 13.50% | 232,750 | 89.3% |
[ 13.5% - 14.0% ] 13.85% | 180,853 | 70.9% |
[ 14.0% - 14.5% ] 14.26% | 94,219 | 78.8% |
[ 14.5% - 15.0% ] 14.61% | 103,341 | 90.1% |
[ 15.0% - 15.5% ] 15.19% | 144,317 | 91.7% |
[ 15.5% - 16.0% ] 15.59% | 207,337 | 92.2% |
[ 15.5% - 16.0% ] 15.86% | 33,709 | 93.0% |
[ 16.0% - 16.5% ] 16.07% | 26,814 | 94.9% |
[ 16.5% - 17.0% ] 16.65% | 14,597 | 94.4% |
[ 17.0% - 17.5% ] 17.04% | 118,661 | 94.0% |
[ 17.0% - 17.5% ] 17.33% | 62,604 | 91.8% |
[ 17.5% - 18.0% ] 17.57% | 86,232 | 87.1% |
[ 17.5% - 18.0% ] 17.94% | 37,320 | 83.2% |
[ 18.5% - 19.0% ] 18.53% | 64,176 | 87.7% |
[ 19.0% - 19.5% ] 19.19% | 10,946 | 89.9% |
[ 19.5% - 20.0% ] 19.62% | 70,810 | 94.3% |
[ 20.0% - 20.5% ] 20.25% | 326 | 100.0% |
[ 21.0% - 21.5% ] 21.04% | 62,232 | 86.4% |
[ 21.5% - 22.0% ] 21.79% | 83,221 | 90.9% |
[ 22.0% - 22.5% ] 22.08% | 40,276 | 93.3% |
[ 22.5% - 23.0% ] 22.54% | 43,269 | 91.6% |
[ 26.0% - 26.5% ] 26.24% | 6,196 | 94.7% |
[ 26.5% - 27.0% ] 26.83% | 35,914 | 86.8% |
[ 28.0% - 28.5% ] 28.25% | 31,807 | 77.1% |
[ 28.5% - 29.0% ] 28.78% | 24,792 | 82.9% |
[ 29.0% - 29.5% ] 29.13% | 1,775 | 98.0% |
[ 32.0% - 32.5% ] 32.36% | 445 | 75.3% |
[ 32.5% - 33.0% ] 32.84% | 48,326 | 91.9% |
[ 35.5% - 36.0% ] 35.77% | 17,163 | 82.5% |
[ 37.0% - 37.5% ] 37.04% | 52,824 | 88.7% |
[ 37.5% - 38.0% ] 37.88% | 59,854 | 89.6% |
[ 38.5% - 39.0% ] 38.75% | 2,867 | 98.8% |
[ 40.0% - 40.5% ] 40.35% | 58,183 | 91.0% |
[ 66.5% - 67.0% ] 66.85% | 531 | 100.0% |