Yaqui 1 or more Vehicles in Household
COMPARE
Yaqui
Select to Compare
1 or more Vehicles in Household
Yaqui 1 or more Vehicles in Household
92.6%
1+ VEHICLES AVAILABLE
100.0/ 100
METRIC RATING
24th/ 347
METRIC RANK
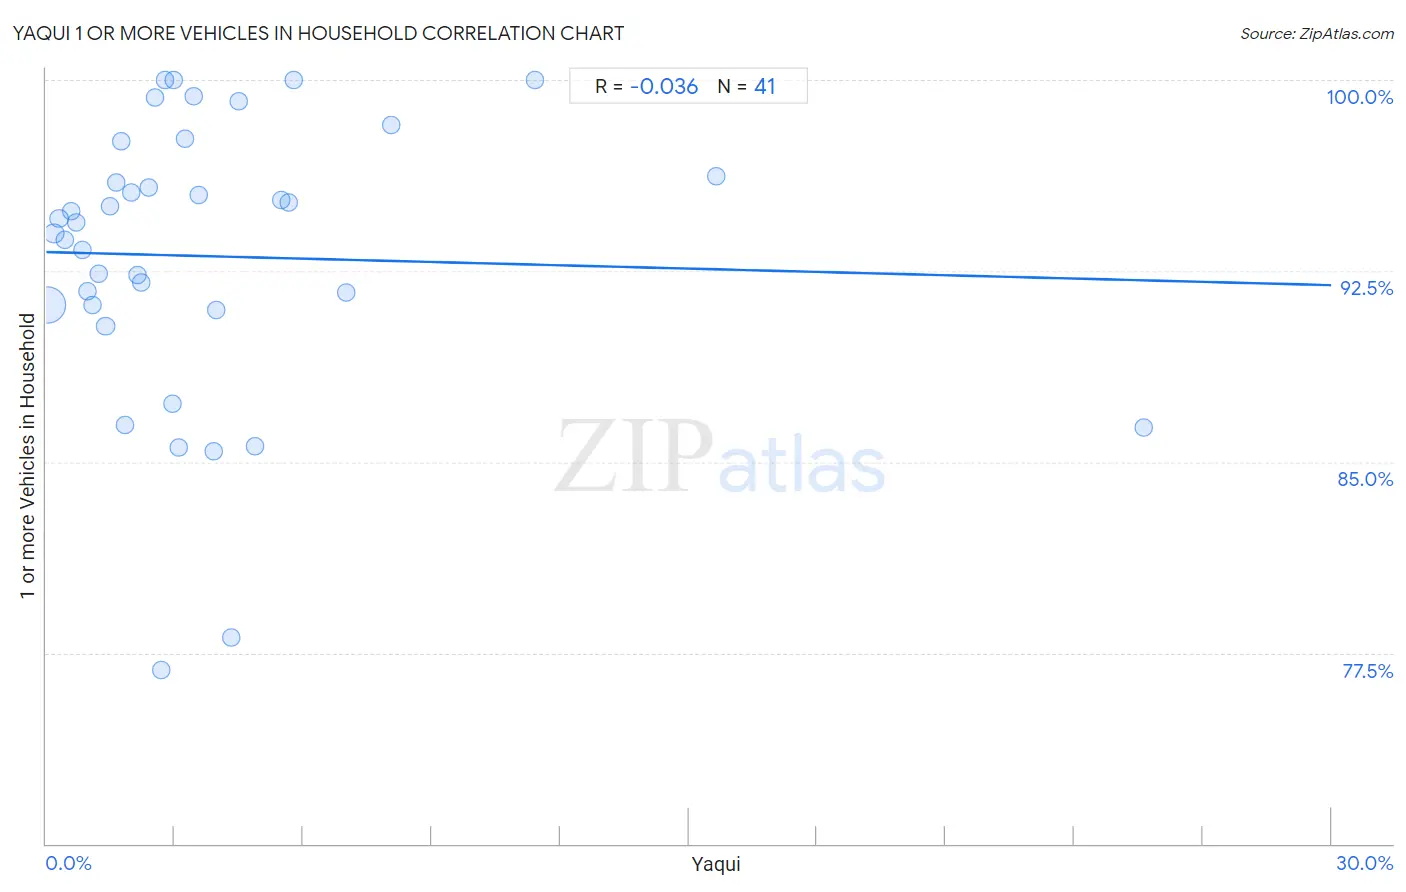
Yaqui 1 or more Vehicles in Household Correlation Chart
The statistical analysis conducted on geographies consisting of 107,720,236 people shows no correlation between the proportion of Yaqui and percentage of households with 1 or more vehicles available in the United States with a correlation coefficient (R) of -0.036 and weighted average of 92.6%. On average, for every 1% (one percent) increase in Yaqui within a typical geography, there is a decrease of 0.043% in percentage of households with 1 or more vehicles available.
It is essential to understand that the correlation between the percentage of Yaqui and percentage of households with 1 or more vehicles available does not imply a direct cause-and-effect relationship. It remains uncertain whether the presence of Yaqui influences an upward or downward trend in the level of percentage of households with 1 or more vehicles available within an area, or if Yaqui simply ended up residing in those areas with higher or lower levels of percentage of households with 1 or more vehicles available due to other factors.
Demographics Similar to Yaqui by 1 or more Vehicles in Household
In terms of 1 or more vehicles in household, the demographic groups most similar to Yaqui are Immigrants from Iraq (92.5%, a difference of 0.020%), British (92.5%, a difference of 0.040%), Nepalese (92.6%, a difference of 0.070%), American (92.5%, a difference of 0.090%), and Sri Lankan (92.5%, a difference of 0.12%).
| Demographics | Rating | Rank | 1 or more Vehicles in Household |
| Europeans | 100.0 /100 | #17 | Exceptional 93.0% |
| Welsh | 100.0 /100 | #18 | Exceptional 93.0% |
| Tongans | 100.0 /100 | #19 | Exceptional 92.9% |
| Arapaho | 100.0 /100 | #20 | Exceptional 92.7% |
| Ottawa | 100.0 /100 | #21 | Exceptional 92.7% |
| French | 100.0 /100 | #22 | Exceptional 92.7% |
| Nepalese | 100.0 /100 | #23 | Exceptional 92.6% |
| Yaqui | 100.0 /100 | #24 | Exceptional 92.6% |
| Immigrants from Iraq | 100.0 /100 | #25 | Exceptional 92.5% |
| British | 100.0 /100 | #26 | Exceptional 92.5% |
| Americans | 100.0 /100 | #27 | Exceptional 92.5% |
| Sri Lankans | 100.0 /100 | #28 | Exceptional 92.5% |
| Native Hawaiians | 100.0 /100 | #29 | Exceptional 92.4% |
| Finns | 100.0 /100 | #30 | Exceptional 92.4% |
| Samoans | 100.0 /100 | #31 | Exceptional 92.4% |
Yaqui 1 or more Vehicles in Household Correlation Summary
| Measurement | Yaqui Data | 1 or more Vehicles in Household Data |
| Minimum | 0.033% | 76.8% |
| Maximum | 25.6% | 100.0% |
| Range | 25.6% | 23.2% |
| Mean | 3.8% | 93.1% |
| Median | 2.7% | 94.4% |
| Interquartile 25% (IQ1) | 1.3% | 91.1% |
| Interquartile 75% (IQ3) | 4.4% | 96.9% |
| Interquartile Range (IQR) | 3.1% | 5.8% |
| Standard Deviation (Sample) | 4.6% | 5.6% |
| Standard Deviation (Population) | 4.6% | 5.5% |
Correlation Details
| Yaqui Percentile | Sample Size | 1 or more Vehicles in Household |
[ 0.0% - 0.5% ] 0.033% | 90,909,943 | 91.2% |
[ 0.0% - 0.5% ] 0.18% | 9,594,308 | 94.0% |
[ 0.0% - 0.5% ] 0.30% | 2,981,801 | 94.6% |
[ 0.0% - 0.5% ] 0.44% | 1,587,389 | 93.7% |
[ 0.5% - 1.0% ] 0.58% | 437,758 | 94.8% |
[ 0.5% - 1.0% ] 0.69% | 356,826 | 94.4% |
[ 0.5% - 1.0% ] 0.83% | 303,432 | 93.3% |
[ 0.5% - 1.0% ] 0.96% | 224,714 | 91.7% |
[ 1.0% - 1.5% ] 1.08% | 79,632 | 91.1% |
[ 1.0% - 1.5% ] 1.22% | 162,236 | 92.4% |
[ 1.0% - 1.5% ] 1.39% | 585,535 | 90.3% |
[ 1.0% - 1.5% ] 1.48% | 25,702 | 95.0% |
[ 1.5% - 2.0% ] 1.65% | 6,066 | 96.0% |
[ 1.5% - 2.0% ] 1.76% | 16,937 | 97.6% |
[ 1.5% - 2.0% ] 1.83% | 61,139 | 86.5% |
[ 1.5% - 2.0% ] 1.97% | 8,068 | 95.6% |
[ 2.0% - 2.5% ] 2.13% | 23,885 | 92.3% |
[ 2.0% - 2.5% ] 2.21% | 96,191 | 92.0% |
[ 2.0% - 2.5% ] 2.41% | 36,650 | 95.8% |
[ 2.5% - 3.0% ] 2.55% | 784 | 99.3% |
[ 2.5% - 3.0% ] 2.68% | 1,454 | 76.8% |
[ 2.5% - 3.0% ] 2.78% | 144 | 100.0% |
[ 2.5% - 3.0% ] 2.94% | 7,359 | 87.3% |
[ 2.5% - 3.0% ] 2.96% | 2,936 | 100.0% |
[ 3.0% - 3.5% ] 3.08% | 6,260 | 85.6% |
[ 3.0% - 3.5% ] 3.23% | 36,828 | 97.7% |
[ 3.0% - 3.5% ] 3.43% | 379 | 99.4% |
[ 3.5% - 4.0% ] 3.55% | 45,881 | 95.5% |
[ 3.5% - 4.0% ] 3.90% | 15,909 | 85.4% |
[ 3.5% - 4.0% ] 3.98% | 57,897 | 91.0% |
[ 4.0% - 4.5% ] 4.31% | 5,125 | 78.1% |
[ 4.0% - 4.5% ] 4.50% | 1,845 | 99.2% |
[ 4.5% - 5.0% ] 4.87% | 1,067 | 85.6% |
[ 5.0% - 5.5% ] 5.49% | 5,574 | 95.3% |
[ 5.5% - 6.0% ] 5.65% | 4,337 | 95.2% |
[ 5.5% - 6.0% ] 5.77% | 52 | 100.0% |
[ 7.0% - 7.5% ] 7.00% | 457 | 91.7% |
[ 8.0% - 8.5% ] 8.06% | 1,266 | 98.2% |
[ 11.0% - 11.5% ] 11.40% | 114 | 100.0% |
[ 15.5% - 16.0% ] 15.65% | 21,021 | 96.2% |
[ 25.5% - 26.0% ] 25.62% | 5,335 | 86.4% |