Immigrants from Fiji 1 or more Vehicles in Household

COMPARE

Immigrants from Fiji
Race
Ancestry
AfghanAfricanAlaska NativeAlaskan AthabascanAlbanianAleutAlsatianAmericanApacheArabArapahoArgentineanArmenianAssyrian/Chaldean/SyriacAustralianAustrianBahamianBangladeshiBarbadianBasqueBelgianBelizeanBermudanBhutaneseBlackfeetBolivianBrazilianBritishBritish West IndianBulgarianBurmeseCajunCambodianCanadianCape VerdeanCarpatho RusynCelticCentral AmericanCentral American IndianCherokeeCheyenneChickasawChileanChineseChippewaChoctawColombianColvilleComancheCosta RicanCreeCreekCroatianCrowCubanCypriotCzechCzechoslovakianDanishDelawareDominicanDutchDutch West IndianEastern EuropeanEcuadorianEgyptianEnglishEstonianEthiopianEuropeanFijianFilipinoFinnishFrenchFrench American IndianFrench CanadianGermanGerman RussianGhanaianGreekGuamanian/ChamorroGuatemalanGuyaneseHaitianHmongHonduranHopiHoumaHungarianIcelanderIndian (Asian)IndonesianInupiatIranianIraqiIrishIroquoisIsraeliItalianJamaicanJapaneseJordanianKenyanKiowaKoreanLaotianLatvianLebaneseLiberianLithuanianLumbeeLuxembourgerMacedonianMalaysianMalteseMarshalleseMenomineeMexicanMexican American IndianMongolianMoroccanNative HawaiianNavajoNepaleseNew ZealanderNicaraguanNigerianNorthern EuropeanNorwegianOkinawanOsageOttawaPaiutePakistaniPalestinianPanamanianParaguayanPennsylvania GermanPeruvianPimaPolishPortuguesePotawatomiPuebloPuerto RicanPuget Sound SalishRomanianRussianSalvadoranSamoanScandinavianScotch-IrishScottishSeminoleSenegaleseSerbianShoshoneSierra LeoneanSiouxSlavicSlovakSloveneSomaliSouth AfricanSouth AmericanSouth American IndianSoviet UnionSpaniardSpanishSpanish AmericanSpanish American IndianSri LankanSubsaharan AfricanSudaneseSwedishSwissSyrianTaiwaneseThaiTlingit-HaidaTohono O'OdhamTonganTrinidadian and TobagonianTsimshianTurkishU.S. Virgin IslanderUgandanUkrainianUruguayanUteVenezuelanVietnameseWelshWest IndianYakamaYaquiYugoslavianYumanYup'ikZimbabwean
Immigration
NonimmigrantsImmigrantsAfghanistanAfricaAlbaniaArgentinaArmeniaAsiaAustraliaAustriaBahamasBangladeshBarbadosBelarusBelgiumBelizeBoliviaBosnia and HerzegovinaBrazilBulgariaBurma/MyanmarCabo VerdeCambodiaCameroonCanadaCaribbeanCentral AmericaChileChinaColombiaCongoCosta RicaCroatiaCubaCzechoslovakiaDenmarkDominicaDominican RepublicEastern AfricaEastern AsiaEastern EuropeEcuadorEgyptEl SalvadorEnglandEritreaEthiopiaEuropeFijiFranceGermanyGhanaGreeceGrenadaGuatemalaGuyanaHaitiHondurasHong KongHungaryIndiaIndonesiaIranIraqIrelandIsraelItalyJamaicaJapanJordanKazakhstanKenyaKoreaKuwaitLaosLatin AmericaLatviaLebanonLiberiaLithuaniaMalaysiaMexicoMicronesiaMiddle AfricaMoldovaMoroccoNepalNetherlandsNicaraguaNigeriaNorth AmericaNorth MacedoniaNorthern AfricaNorthern EuropeNorwayOceaniaPakistanPanamaPeruPhilippinesPolandPortugalRomaniaRussiaSaudi ArabiaScotlandSenegalSerbiaSierra LeoneSingaporeSomaliaSouth AfricaSouth AmericaSouth Central AsiaSouth Eastern AsiaSouthern EuropeSpainSri LankaSt. Vincent and the GrenadinesSudanSwedenSwitzerlandSyriaTaiwanThailandTrinidad and TobagoTurkeyUgandaUkraineUruguayUzbekistanVenezuelaVietnamWest IndiesWestern AfricaWestern AsiaWestern EuropeYemenZaireZimbabweAzores
Select to Compare
Race
Ancestry
AfghanAfricanAlaska NativeAlaskan AthabascanAlbanianAleutAlsatianAmericanApacheArabArapahoArgentineanArmenianAssyrian/Chaldean/SyriacAustralianAustrianBahamianBangladeshiBarbadianBasqueBelgianBelizeanBermudanBhutaneseBlackfeetBolivianBrazilianBritishBritish West IndianBulgarianBurmeseCajunCambodianCanadianCape VerdeanCarpatho RusynCelticCentral AmericanCentral American IndianCherokeeCheyenneChickasawChileanChineseChippewaChoctawColombianColvilleComancheCosta RicanCreeCreekCroatianCrowCubanCypriotCzechCzechoslovakianDanishDelawareDominicanDutchDutch West IndianEastern EuropeanEcuadorianEgyptianEnglishEstonianEthiopianEuropeanFijianFilipinoFinnishFrenchFrench American IndianFrench CanadianGermanGerman RussianGhanaianGreekGuamanian/ChamorroGuatemalanGuyaneseHaitianHmongHonduranHopiHoumaHungarianIcelanderIndian (Asian)IndonesianInupiatIranianIraqiIrishIroquoisIsraeliItalianJamaicanJapaneseJordanianKenyanKiowaKoreanLaotianLatvianLebaneseLiberianLithuanianLumbeeLuxembourgerMacedonianMalaysianMalteseMarshalleseMenomineeMexicanMexican American IndianMongolianMoroccanNative HawaiianNavajoNepaleseNew ZealanderNicaraguanNigerianNorthern EuropeanNorwegianOkinawanOsageOttawaPaiutePakistaniPalestinianPanamanianParaguayanPennsylvania GermanPeruvianPimaPolishPortuguesePotawatomiPuebloPuerto RicanPuget Sound SalishRomanianRussianSalvadoranSamoanScandinavianScotch-IrishScottishSeminoleSenegaleseSerbianShoshoneSierra LeoneanSiouxSlavicSlovakSloveneSomaliSouth AfricanSouth AmericanSouth American IndianSoviet UnionSpaniardSpanishSpanish AmericanSpanish American IndianSri LankanSubsaharan AfricanSudaneseSwedishSwissSyrianTaiwaneseThaiTlingit-HaidaTohono O'OdhamTonganTrinidadian and TobagonianTsimshianTurkishU.S. Virgin IslanderUgandanUkrainianUruguayanUteVenezuelanVietnameseWelshWest IndianYakamaYaquiYugoslavianYumanYup'ikZimbabwean
Immigration
NonimmigrantsImmigrantsAfghanistanAfricaAlbaniaArgentinaArmeniaAsiaAustraliaAustriaBahamasBangladeshBarbadosBelarusBelgiumBelizeBoliviaBosnia and HerzegovinaBrazilBulgariaBurma/MyanmarCabo VerdeCambodiaCameroonCanadaCaribbeanCentral AmericaChileChinaColombiaCongoCosta RicaCroatiaCubaCzechoslovakiaDenmarkDominicaDominican RepublicEastern AfricaEastern AsiaEastern EuropeEcuadorEgyptEl SalvadorEnglandEritreaEthiopiaEuropeFranceGermanyGhanaGreeceGrenadaGuatemalaGuyanaHaitiHondurasHong KongHungaryIndiaIndonesiaIranIraqIrelandIsraelItalyJamaicaJapanJordanKazakhstanKenyaKoreaKuwaitLaosLatin AmericaLatviaLebanonLiberiaLithuaniaMalaysiaMexicoMicronesiaMiddle AfricaMoldovaMoroccoNepalNetherlandsNicaraguaNigeriaNorth AmericaNorth MacedoniaNorthern AfricaNorthern EuropeNorwayOceaniaPakistanPanamaPeruPhilippinesPolandPortugalRomaniaRussiaSaudi ArabiaScotlandSenegalSerbiaSierra LeoneSingaporeSomaliaSouth AfricaSouth AmericaSouth Central AsiaSouth Eastern AsiaSouthern EuropeSpainSri LankaSt. Vincent and the GrenadinesSudanSwedenSwitzerlandSyriaTaiwanThailandTrinidad and TobagoTurkeyUgandaUkraineUruguayUzbekistanVenezuelaVietnamWest IndiesWestern AfricaWestern AsiaWestern EuropeYemenZaireZimbabweAzores
1 or more Vehicles in Household
Income
Poverty
Unemployment
Labor Participation
Family Structure
Vehicle Availability
Education Level
Disability

Immigrants from Fiji 1 or more Vehicles in Household
Exceptional

92.2%
1+ VEHICLES AVAILABLE
99.9/ 100
METRIC RATING
46th/ 347
METRIC RANK

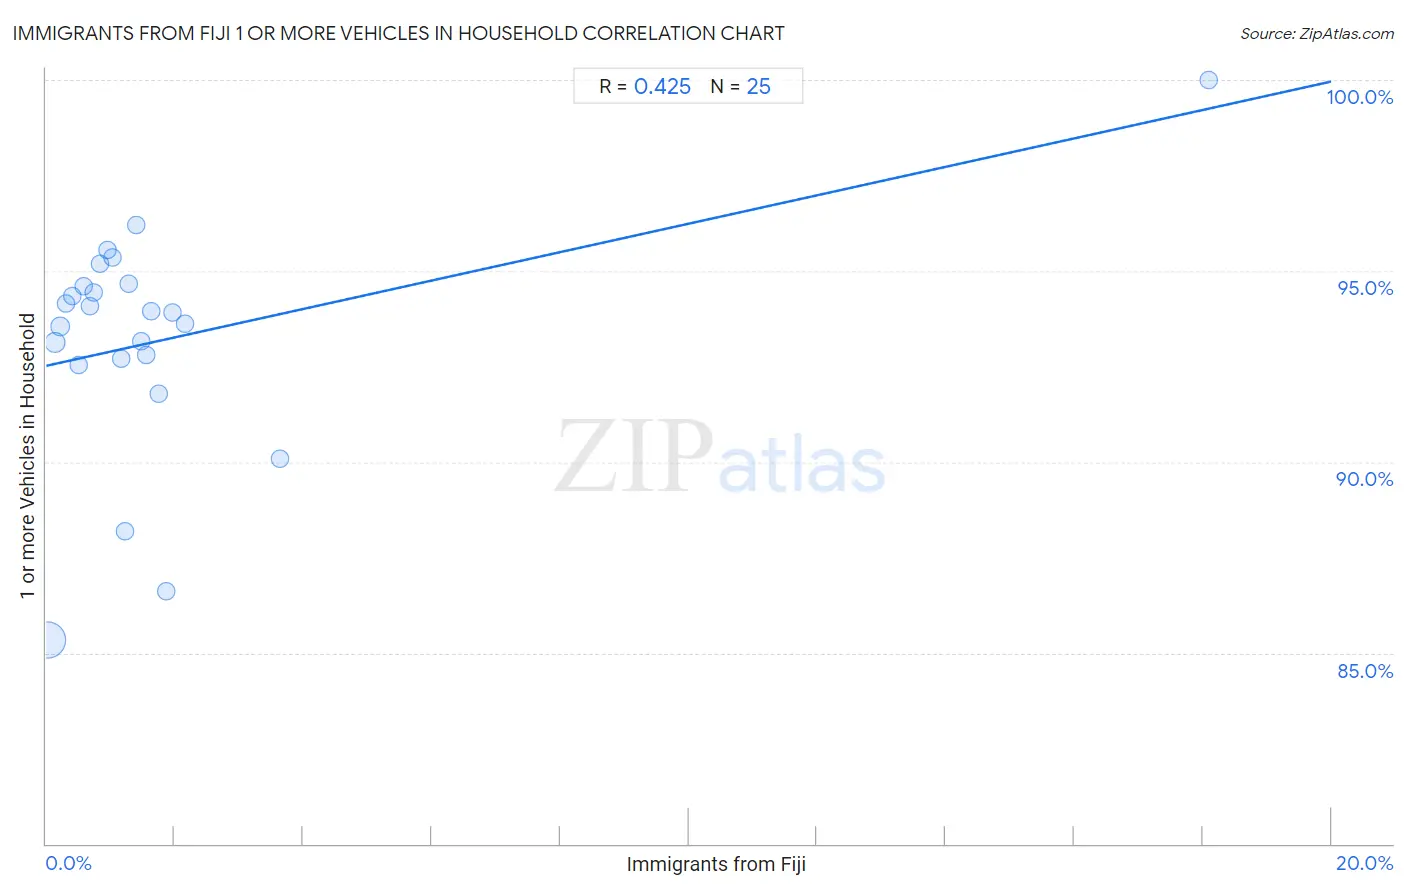
Immigrants from Fiji 1 or more Vehicles in Household Correlation Chart

The statistical analysis conducted on geographies consisting of 93,754,900 people shows a moderate positive correlation between the proportion of Immigrants from Fiji and percentage of households with 1 or more vehicles available in the United States with a correlation coefficient (R) of 0.425 and weighted average of 92.2%. On average, for every 1% (one percent) increase in Immigrants from Fiji within a typical geography, there is an increase of 0.37% in percentage of households with 1 or more vehicles available.
Immigrants from Fiji 1 or more Vehicles in Household
It is essential to understand that the correlation between the percentage of Immigrants from Fiji and percentage of households with 1 or more vehicles available does not imply a direct cause-and-effect relationship. It remains uncertain whether the presence of Immigrants from Fiji influences an upward or downward trend in the level of percentage of households with 1 or more vehicles available within an area, or if Immigrants from Fiji simply ended up residing in those areas with higher or lower levels of percentage of households with 1 or more vehicles available due to other factors.

Demographics Similar to Immigrants from Fiji by 1 or more Vehicles in Household

In terms of 1 or more vehicles in household, the demographic groups most similar to Immigrants from Fiji are Northern European (92.2%, a difference of 0.010%), Nonimmigrants (92.2%, a difference of 0.020%), Choctaw (92.2%, a difference of 0.040%), Spanish (92.3%, a difference of 0.060%), and Immigrants from Taiwan (92.3%, a difference of 0.070%).
DemographicsRating | Rank1 or more Vehicles in Household
Swiss
99.9
/100
|
#39
Exceptional
92.3%
Creek
99.9
/100
|
#40
Exceptional
92.3%
Immigrants from Taiwan
99.9
/100
|
#41
Exceptional
92.3%
Chickasaw
99.9
/100
|
#42
Exceptional
92.3%
Spanish
99.9
/100
|
#43
Exceptional
92.3%
Choctaw
99.9
/100
|
#44
Exceptional
92.2%
Nonimmigrants
99.9
/100
|
#45
Exceptional
92.2%
Immigrants from Fiji
99.9
/100
|
#46
Exceptional
92.2%
Northern Europeans
99.9
/100
|
#47
Exceptional
92.2%
Belgians
99.9
/100
|
#48
Exceptional
92.1%
Afghans
99.9
/100
|
#49
Exceptional
92.1%
Guamanians/Chamorros
99.9
/100
|
#50
Exceptional
92.1%
Celtics
99.9
/100
|
#51
Exceptional
92.1%
Koreans
99.9
/100
|
#52
Exceptional
92.1%
Hawaiians
99.9
/100
|
#53
Exceptional
92.0%

Immigrants from Fiji 1 or more Vehicles in Household Correlation Summary

MeasurementImmigrants from Fiji Data1 or more Vehicles in Household Data
Minimum0.020%85.3%
Maximum18.1%100.0%
Range18.1%14.7%
Mean1.8%93.2%
Median1.2%93.9%
Interquartile 25% (IQ1)0.54%92.6%
Interquartile 75% (IQ3)1.7%94.6%
Interquartile Range (IQR)1.1%2.0%
Standard Deviation (Sample)3.5%3.0%
Standard Deviation (Population)3.4%3.0%

Correlation Details

Immigrants from Fiji PercentileSample Size1 or more Vehicles in Household
[
0.0%
-
0.5%
]
0.020%
73,451,04585.3%
[
0.0%
-
0.5%
]
0.13%
9,801,78393.1%
[
0.0%
-
0.5%
]
0.22%
3,283,37093.5%
[
0.0%
-
0.5%
]
0.31%
1,978,28994.2%
[
0.0%
-
0.5%
]
0.40%
1,496,95694.3%
[
0.0%
-
0.5%
]
0.50%
213,80692.5%
[
0.5%
-
1.0%
]
0.58%
532,51594.6%
[
0.5%
-
1.0%
]
0.68%
650,14594.1%
[
0.5%
-
1.0%
]
0.74%
381,49894.4%
[
0.5%
-
1.0%
]
0.84%
174,60795.2%
[
0.5%
-
1.0%
]
0.96%
116,49895.5%
[
1.0%
-
1.5%
]
1.03%
280,42995.3%
[
1.0%
-
1.5%
]
1.16%
609,30592.7%
[
1.0%
-
1.5%
]
1.22%
14,29188.2%
[
1.0%
-
1.5%
]
1.28%
199,40594.7%
[
1.0%
-
1.5%
]
1.40%
110,57296.2%
[
1.0%
-
1.5%
]
1.48%
85,41093.2%
[
1.5%
-
2.0%
]
1.55%
84,19792.8%
[
1.5%
-
2.0%
]
1.63%
77,71293.9%
[
1.5%
-
2.0%
]
1.75%
8,92091.8%
[
1.5%
-
2.0%
]
1.87%
5,41186.6%
[
1.5%
-
2.0%
]
1.96%
60,85093.9%
[
2.0%
-
2.5%
]
2.15%
41,59993.6%
[
3.5%
-
4.0%
]
3.64%
96,09990.1%
[
18.0%
-
18.5%
]
18.09%
188100.0%