Subsaharan African Self-Care Disability
COMPARE
Subsaharan African
Select to Compare
Self-Care Disability
Subsaharan African Self-Care Disability
2.6%
SELF-CARE DISABILITY
4.0/ 100
METRIC RATING
220th/ 347
METRIC RANK
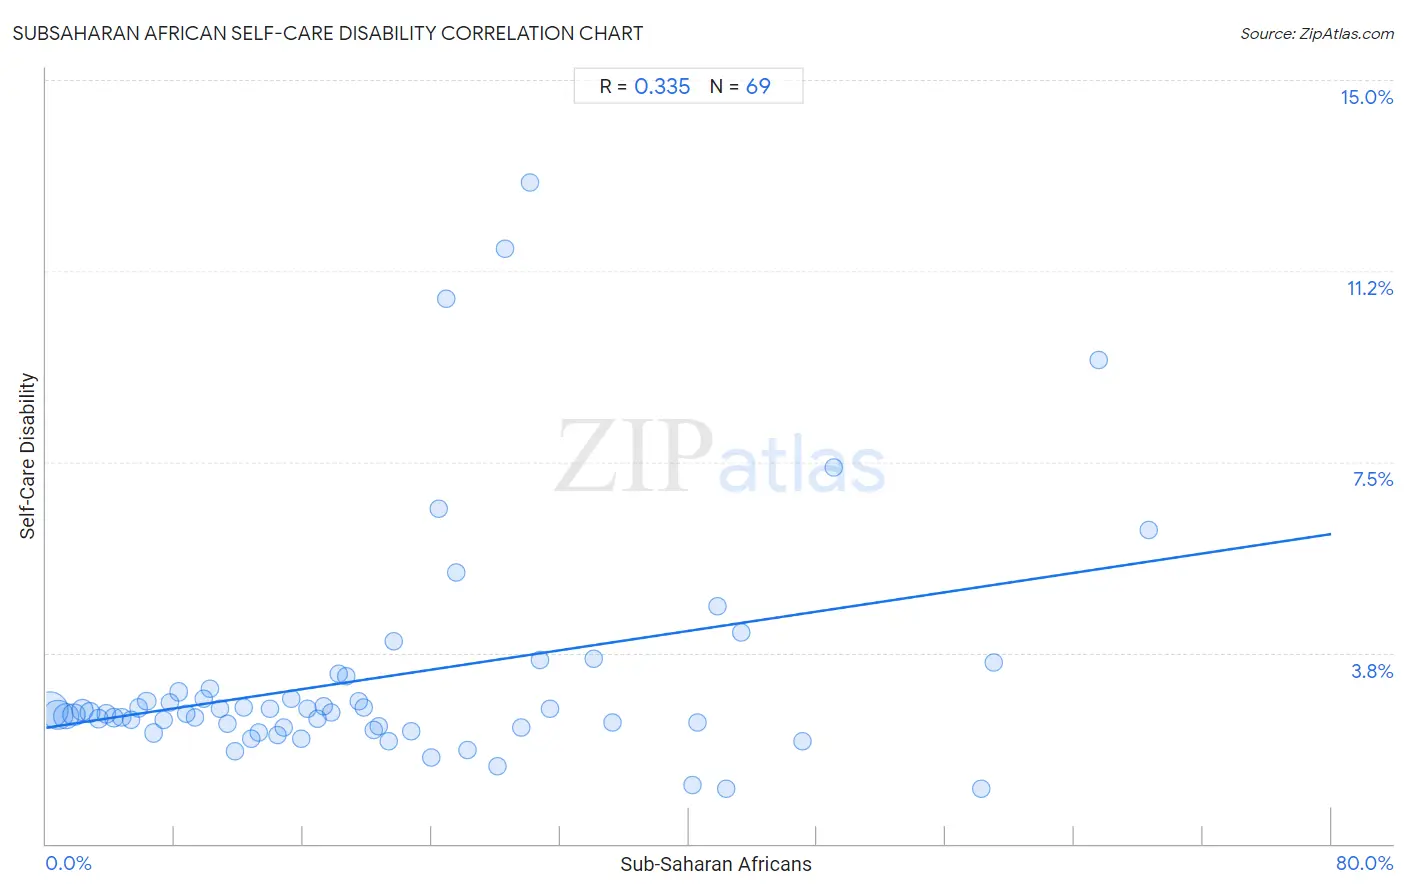
Subsaharan African Self-Care Disability Correlation Chart
The statistical analysis conducted on geographies consisting of 507,052,874 people shows a mild positive correlation between the proportion of Sub-Saharan Africans and percentage of population with self-care disability in the United States with a correlation coefficient (R) of 0.335 and weighted average of 2.6%. On average, for every 1% (one percent) increase in Sub-Saharan Africans within a typical geography, there is an increase of 0.048% in percentage of population with self-care disability.
It is essential to understand that the correlation between the percentage of Sub-Saharan Africans and percentage of population with self-care disability does not imply a direct cause-and-effect relationship. It remains uncertain whether the presence of Sub-Saharan Africans influences an upward or downward trend in the level of percentage of population with self-care disability within an area, or if Sub-Saharan Africans simply ended up residing in those areas with higher or lower levels of percentage of population with self-care disability due to other factors.
Demographics Similar to Sub-Saharan Africans by Self-Care Disability
In terms of self-care disability, the demographic groups most similar to Sub-Saharan Africans are Immigrants from Moldova (2.6%, a difference of 0.010%), Scotch-Irish (2.6%, a difference of 0.040%), Honduran (2.6%, a difference of 0.040%), Spaniard (2.6%, a difference of 0.050%), and French Canadian (2.6%, a difference of 0.050%).
| Demographics | Rating | Rank | Self-Care Disability |
| Ecuadorians | 4.7 /100 | #213 | Tragic 2.6% |
| Immigrants from Honduras | 4.7 /100 | #214 | Tragic 2.6% |
| Immigrants from Thailand | 4.5 /100 | #215 | Tragic 2.6% |
| Whites/Caucasians | 4.4 /100 | #216 | Tragic 2.6% |
| Celtics | 4.4 /100 | #217 | Tragic 2.6% |
| Scotch-Irish | 4.1 /100 | #218 | Tragic 2.6% |
| Immigrants from Moldova | 4.0 /100 | #219 | Tragic 2.6% |
| Sub-Saharan Africans | 4.0 /100 | #220 | Tragic 2.6% |
| Hondurans | 3.8 /100 | #221 | Tragic 2.6% |
| Spaniards | 3.8 /100 | #222 | Tragic 2.6% |
| French Canadians | 3.8 /100 | #223 | Tragic 2.6% |
| Osage | 3.6 /100 | #224 | Tragic 2.6% |
| Iraqis | 3.2 /100 | #225 | Tragic 2.6% |
| Chinese | 2.9 /100 | #226 | Tragic 2.6% |
| Immigrants from Philippines | 2.7 /100 | #227 | Tragic 2.6% |
Subsaharan African Self-Care Disability Correlation Summary
| Measurement | Subsaharan African Data | Self-Care Disability Data |
| Minimum | 0.24% | 1.1% |
| Maximum | 68.6% | 13.0% |
| Range | 68.4% | 11.9% |
| Mean | 20.8% | 3.3% |
| Median | 17.3% | 2.6% |
| Interquartile 25% (IQ1) | 8.5% | 2.3% |
| Interquartile 75% (IQ3) | 29.1% | 3.0% |
| Interquartile Range (IQR) | 20.6% | 0.74% |
| Standard Deviation (Sample) | 16.2% | 2.3% |
| Standard Deviation (Population) | 16.0% | 2.3% |
Correlation Details
| Subsaharan African Percentile | Sample Size | Self-Care Disability |
[ 0.0% - 0.5% ] 0.24% | 172,231,792 | 2.6% |
[ 0.5% - 1.0% ] 0.72% | 106,781,705 | 2.5% |
[ 1.0% - 1.5% ] 1.24% | 70,564,295 | 2.5% |
[ 1.5% - 2.0% ] 1.73% | 41,187,258 | 2.5% |
[ 2.0% - 2.5% ] 2.25% | 34,229,100 | 2.6% |
[ 2.5% - 3.0% ] 2.73% | 23,361,786 | 2.6% |
[ 3.0% - 3.5% ] 3.23% | 13,229,048 | 2.5% |
[ 3.5% - 4.0% ] 3.75% | 9,263,399 | 2.6% |
[ 4.0% - 4.5% ] 4.22% | 8,827,561 | 2.5% |
[ 4.5% - 5.0% ] 4.71% | 4,053,662 | 2.5% |
[ 5.0% - 5.5% ] 5.29% | 3,766,209 | 2.4% |
[ 5.5% - 6.0% ] 5.77% | 3,279,032 | 2.7% |
[ 6.0% - 6.5% ] 6.26% | 2,188,060 | 2.8% |
[ 6.5% - 7.0% ] 6.66% | 2,514,422 | 2.2% |
[ 7.0% - 7.5% ] 7.34% | 1,480,021 | 2.4% |
[ 7.5% - 8.0% ] 7.73% | 1,547,036 | 2.8% |
[ 8.0% - 8.5% ] 8.23% | 987,882 | 3.0% |
[ 8.5% - 9.0% ] 8.72% | 992,323 | 2.6% |
[ 9.0% - 9.5% ] 9.27% | 868,844 | 2.5% |
[ 9.5% - 10.0% ] 9.78% | 411,142 | 2.8% |
[ 10.0% - 10.5% ] 10.22% | 751,206 | 3.0% |
[ 10.5% - 11.0% ] 10.78% | 526,339 | 2.7% |
[ 11.0% - 11.5% ] 11.27% | 652,030 | 2.3% |
[ 11.5% - 12.0% ] 11.75% | 279,205 | 1.8% |
[ 12.0% - 12.5% ] 12.27% | 100,105 | 2.7% |
[ 12.5% - 13.0% ] 12.77% | 185,624 | 2.1% |
[ 13.0% - 13.5% ] 13.23% | 438,825 | 2.2% |
[ 13.5% - 14.0% ] 13.92% | 338,554 | 2.7% |
[ 14.0% - 14.5% ] 14.38% | 83,868 | 2.1% |
[ 14.5% - 15.0% ] 14.81% | 134,284 | 2.3% |
[ 15.0% - 15.5% ] 15.22% | 236,255 | 2.9% |
[ 15.5% - 16.0% ] 15.84% | 217,032 | 2.1% |
[ 16.0% - 16.5% ] 16.25% | 194,429 | 2.6% |
[ 16.5% - 17.0% ] 16.91% | 29,350 | 2.4% |
[ 17.0% - 17.5% ] 17.26% | 145,391 | 2.7% |
[ 17.5% - 18.0% ] 17.73% | 65,973 | 2.6% |
[ 18.0% - 18.5% ] 18.20% | 220,571 | 3.3% |
[ 18.5% - 19.0% ] 18.66% | 97,301 | 3.3% |
[ 19.0% - 19.5% ] 19.43% | 243,201 | 2.8% |
[ 19.5% - 20.0% ] 19.74% | 19,365 | 2.7% |
[ 20.0% - 20.5% ] 20.40% | 38,685 | 2.2% |
[ 20.5% - 21.0% ] 20.73% | 34,710 | 2.3% |
[ 21.0% - 21.5% ] 21.32% | 25,224 | 2.0% |
[ 21.5% - 22.0% ] 21.65% | 54,524 | 4.0% |
[ 22.5% - 23.0% ] 22.71% | 50,564 | 2.2% |
[ 23.5% - 24.0% ] 23.99% | 14,696 | 1.7% |
[ 24.0% - 24.5% ] 24.44% | 24,894 | 6.6% |
[ 24.5% - 25.0% ] 24.91% | 273 | 10.7% |
[ 25.5% - 26.0% ] 25.54% | 881 | 5.3% |
[ 26.0% - 26.5% ] 26.24% | 2,138 | 1.8% |
[ 28.0% - 28.5% ] 28.06% | 29,898 | 1.5% |
[ 28.5% - 29.0% ] 28.57% | 154 | 11.7% |
[ 29.5% - 30.0% ] 29.55% | 44 | 2.3% |
[ 30.0% - 30.5% ] 30.12% | 1,932 | 13.0% |
[ 30.5% - 31.0% ] 30.74% | 15,489 | 3.6% |
[ 31.0% - 31.5% ] 31.35% | 2,485 | 2.6% |
[ 34.0% - 34.5% ] 34.07% | 3,824 | 3.6% |
[ 35.0% - 35.5% ] 35.23% | 1,286 | 2.4% |
[ 40.0% - 40.5% ] 40.22% | 4,572 | 1.1% |
[ 40.5% - 41.0% ] 40.56% | 9,613 | 2.4% |
[ 41.5% - 42.0% ] 41.76% | 613 | 4.7% |
[ 42.0% - 42.5% ] 42.31% | 338 | 1.1% |
[ 43.0% - 43.5% ] 43.29% | 633 | 4.1% |
[ 47.0% - 47.5% ] 47.10% | 1,157 | 2.0% |
[ 49.0% - 49.5% ] 49.02% | 9,074 | 7.4% |
[ 58.0% - 58.5% ] 58.19% | 574 | 1.1% |
[ 59.0% - 59.5% ] 59.02% | 549 | 3.6% |
[ 65.5% - 66.0% ] 65.55% | 479 | 9.5% |
[ 68.5% - 69.0% ] 68.60% | 86 | 6.2% |