Immigrants from Zimbabwe 1 or more Vehicles in Household
COMPARE
Immigrants from Zimbabwe
Select to Compare
1 or more Vehicles in Household
Immigrants from Zimbabwe 1 or more Vehicles in Household
90.2%
1+ VEHICLES AVAILABLE
81.5/ 100
METRIC RATING
144th/ 347
METRIC RANK
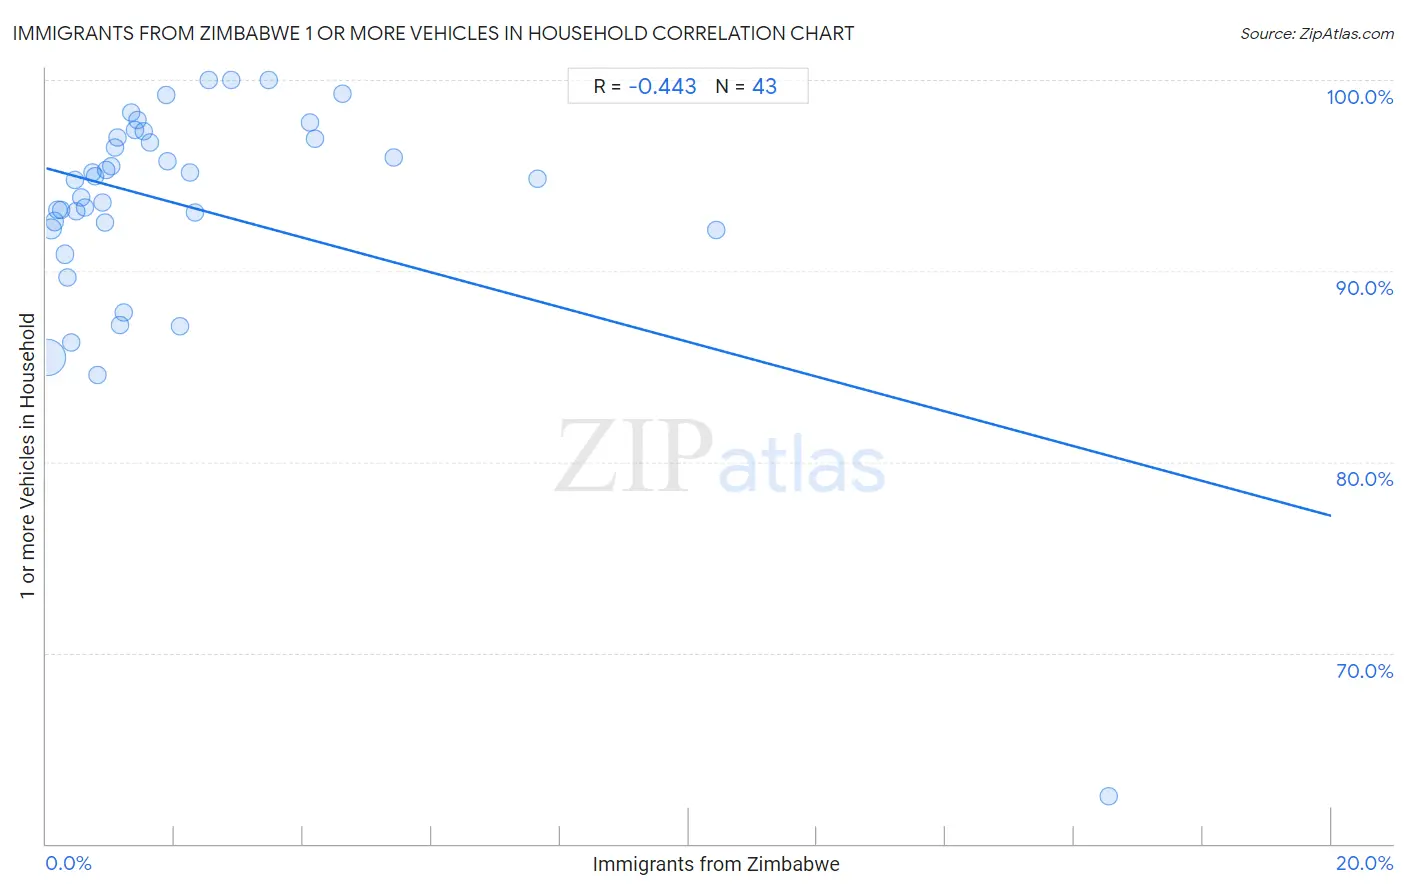
Immigrants from Zimbabwe 1 or more Vehicles in Household Correlation Chart
The statistical analysis conducted on geographies consisting of 117,752,092 people shows a moderate negative correlation between the proportion of Immigrants from Zimbabwe and percentage of households with 1 or more vehicles available in the United States with a correlation coefficient (R) of -0.443 and weighted average of 90.2%. On average, for every 1% (one percent) increase in Immigrants from Zimbabwe within a typical geography, there is a decrease of 0.91% in percentage of households with 1 or more vehicles available.
It is essential to understand that the correlation between the percentage of Immigrants from Zimbabwe and percentage of households with 1 or more vehicles available does not imply a direct cause-and-effect relationship. It remains uncertain whether the presence of Immigrants from Zimbabwe influences an upward or downward trend in the level of percentage of households with 1 or more vehicles available within an area, or if Immigrants from Zimbabwe simply ended up residing in those areas with higher or lower levels of percentage of households with 1 or more vehicles available due to other factors.
Demographics Similar to Immigrants from Zimbabwe by 1 or more Vehicles in Household
In terms of 1 or more vehicles in household, the demographic groups most similar to Immigrants from Zimbabwe are Immigrants from Bahamas (90.2%, a difference of 0.0%), Sioux (90.2%, a difference of 0.0%), Bahamian (90.2%, a difference of 0.020%), Immigrants from Moldova (90.2%, a difference of 0.040%), and Immigrants from Lithuania (90.2%, a difference of 0.040%).
| Demographics | Rating | Rank | 1 or more Vehicles in Household |
| Latvians | 86.3 /100 | #137 | Excellent 90.3% |
| Syrians | 86.3 /100 | #138 | Excellent 90.3% |
| Estonians | 85.6 /100 | #139 | Excellent 90.3% |
| Sudanese | 85.2 /100 | #140 | Excellent 90.3% |
| Immigrants from Moldova | 83.1 /100 | #141 | Excellent 90.2% |
| Immigrants from Lithuania | 83.0 /100 | #142 | Excellent 90.2% |
| Immigrants from Bahamas | 81.5 /100 | #143 | Excellent 90.2% |
| Immigrants from Zimbabwe | 81.5 /100 | #144 | Excellent 90.2% |
| Sioux | 81.3 /100 | #145 | Excellent 90.2% |
| Bahamians | 80.5 /100 | #146 | Excellent 90.2% |
| Chileans | 79.8 /100 | #147 | Good 90.2% |
| Immigrants from Eastern Africa | 78.2 /100 | #148 | Good 90.1% |
| Immigrants from Nicaragua | 76.7 /100 | #149 | Good 90.1% |
| Immigrants from Micronesia | 75.9 /100 | #150 | Good 90.1% |
| Immigrants from Bosnia and Herzegovina | 75.4 /100 | #151 | Good 90.1% |
Immigrants from Zimbabwe 1 or more Vehicles in Household Correlation Summary
| Measurement | Immigrants from Zimbabwe Data | 1 or more Vehicles in Household Data |
| Minimum | 0.017% | 62.5% |
| Maximum | 16.5% | 100.0% |
| Range | 16.5% | 37.5% |
| Mean | 2.2% | 93.4% |
| Median | 1.2% | 94.9% |
| Interquartile 25% (IQ1) | 0.55% | 92.2% |
| Interquartile 75% (IQ3) | 2.3% | 97.0% |
| Interquartile Range (IQR) | 1.8% | 4.8% |
| Standard Deviation (Sample) | 3.1% | 6.3% |
| Standard Deviation (Population) | 3.0% | 6.2% |
Correlation Details
| Immigrants from Zimbabwe Percentile | Sample Size | 1 or more Vehicles in Household |
[ 0.0% - 0.5% ] 0.017% | 96,584,996 | 85.5% |
[ 0.0% - 0.5% ] 0.074% | 11,551,653 | 92.2% |
[ 0.0% - 0.5% ] 0.13% | 3,964,784 | 92.6% |
[ 0.0% - 0.5% ] 0.18% | 2,085,630 | 93.2% |
[ 0.0% - 0.5% ] 0.23% | 883,576 | 93.2% |
[ 0.0% - 0.5% ] 0.29% | 670,593 | 90.9% |
[ 0.0% - 0.5% ] 0.33% | 478,711 | 89.6% |
[ 0.0% - 0.5% ] 0.39% | 337,090 | 86.2% |
[ 0.0% - 0.5% ] 0.45% | 355,667 | 94.7% |
[ 0.0% - 0.5% ] 0.48% | 94,478 | 93.1% |
[ 0.5% - 1.0% ] 0.55% | 235,275 | 93.9% |
[ 0.5% - 1.0% ] 0.61% | 83,805 | 93.3% |
[ 0.5% - 1.0% ] 0.71% | 39,523 | 95.1% |
[ 0.5% - 1.0% ] 0.76% | 76,479 | 95.0% |
[ 0.5% - 1.0% ] 0.79% | 53,714 | 84.6% |
[ 0.5% - 1.0% ] 0.88% | 13,719 | 93.6% |
[ 0.5% - 1.0% ] 0.91% | 57,422 | 92.6% |
[ 0.5% - 1.0% ] 0.94% | 3,935 | 95.3% |
[ 1.0% - 1.5% ] 1.02% | 32,114 | 95.5% |
[ 1.0% - 1.5% ] 1.06% | 4,790 | 96.4% |
[ 1.0% - 1.5% ] 1.11% | 31,316 | 97.0% |
[ 1.0% - 1.5% ] 1.16% | 4,413 | 87.2% |
[ 1.0% - 1.5% ] 1.20% | 916 | 87.9% |
[ 1.0% - 1.5% ] 1.33% | 18,115 | 98.3% |
[ 1.0% - 1.5% ] 1.38% | 4,773 | 97.4% |
[ 1.0% - 1.5% ] 1.43% | 3,572 | 97.9% |
[ 1.5% - 2.0% ] 1.52% | 197 | 97.3% |
[ 1.5% - 2.0% ] 1.62% | 26,607 | 96.8% |
[ 1.5% - 2.0% ] 1.86% | 1,664 | 99.2% |
[ 1.5% - 2.0% ] 1.88% | 1,221 | 95.8% |
[ 2.0% - 2.5% ] 2.08% | 3,801 | 87.1% |
[ 2.0% - 2.5% ] 2.23% | 20,716 | 95.2% |
[ 2.0% - 2.5% ] 2.32% | 18,077 | 93.1% |
[ 2.5% - 3.0% ] 2.54% | 197 | 100.0% |
[ 2.5% - 3.0% ] 2.88% | 208 | 100.0% |
[ 3.0% - 3.5% ] 3.47% | 173 | 100.0% |
[ 4.0% - 4.5% ] 4.10% | 1,513 | 97.7% |
[ 4.0% - 4.5% ] 4.19% | 2,961 | 96.9% |
[ 4.5% - 5.0% ] 4.62% | 1,473 | 99.3% |
[ 5.0% - 5.5% ] 5.42% | 1,366 | 96.0% |
[ 7.5% - 8.0% ] 7.64% | 419 | 94.9% |
[ 10.0% - 10.5% ] 10.42% | 307 | 92.2% |
[ 16.5% - 17.0% ] 16.54% | 133 | 62.5% |