Scandinavian 1 or more Vehicles in Household
COMPARE
Scandinavian
Select to Compare
1 or more Vehicles in Household
Scandinavian 1 or more Vehicles in Household
93.1%
1+ VEHICLES AVAILABLE
100.0/ 100
METRIC RATING
12th/ 347
METRIC RANK
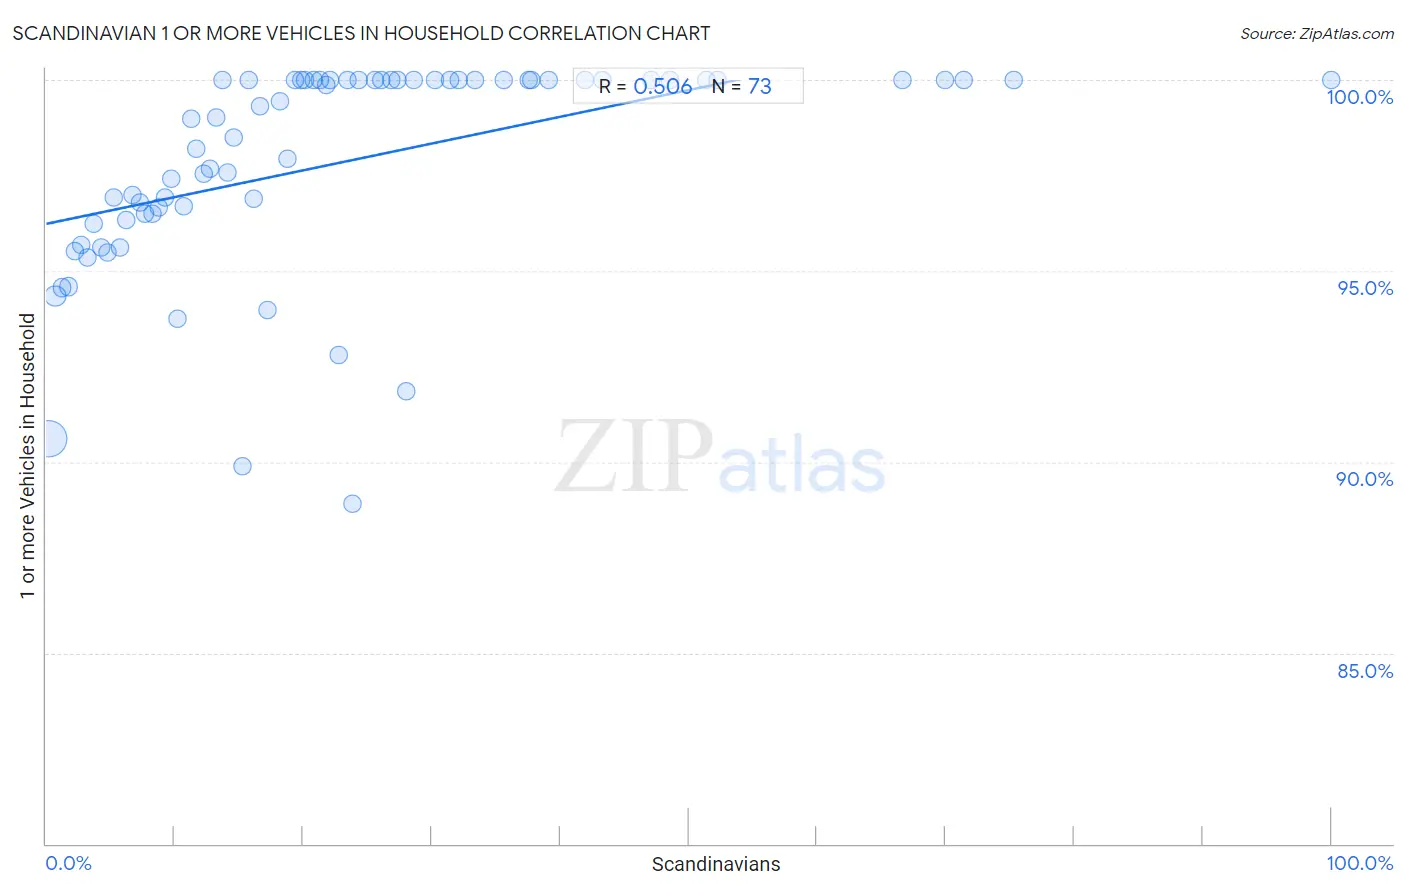
Scandinavian 1 or more Vehicles in Household Correlation Chart
The statistical analysis conducted on geographies consisting of 472,348,327 people shows a substantial positive correlation between the proportion of Scandinavians and percentage of households with 1 or more vehicles available in the United States with a correlation coefficient (R) of 0.506 and weighted average of 93.1%. On average, for every 1% (one percent) increase in Scandinavians within a typical geography, there is an increase of 0.070% in percentage of households with 1 or more vehicles available.
It is essential to understand that the correlation between the percentage of Scandinavians and percentage of households with 1 or more vehicles available does not imply a direct cause-and-effect relationship. It remains uncertain whether the presence of Scandinavians influences an upward or downward trend in the level of percentage of households with 1 or more vehicles available within an area, or if Scandinavians simply ended up residing in those areas with higher or lower levels of percentage of households with 1 or more vehicles available due to other factors.
Demographics Similar to Scandinavians by 1 or more Vehicles in Household
In terms of 1 or more vehicles in household, the demographic groups most similar to Scandinavians are White/Caucasian (93.1%, a difference of 0.020%), Irish (93.1%, a difference of 0.060%), Mexican (93.0%, a difference of 0.080%), Assyrian/Chaldean/Syriac (93.0%, a difference of 0.080%), and European (93.0%, a difference of 0.11%).
| Demographics | Rating | Rank | 1 or more Vehicles in Household |
| Yakama | 100.0 /100 | #5 | Exceptional 93.6% |
| Danes | 100.0 /100 | #6 | Exceptional 93.5% |
| Scottish | 100.0 /100 | #7 | Exceptional 93.4% |
| Swedes | 100.0 /100 | #8 | Exceptional 93.3% |
| Scotch-Irish | 100.0 /100 | #9 | Exceptional 93.3% |
| Dutch | 100.0 /100 | #10 | Exceptional 93.3% |
| Czechs | 100.0 /100 | #11 | Exceptional 93.3% |
| Scandinavians | 100.0 /100 | #12 | Exceptional 93.1% |
| Whites/Caucasians | 100.0 /100 | #13 | Exceptional 93.1% |
| Irish | 100.0 /100 | #14 | Exceptional 93.1% |
| Mexicans | 100.0 /100 | #15 | Exceptional 93.0% |
| Assyrians/Chaldeans/Syriacs | 100.0 /100 | #16 | Exceptional 93.0% |
| Europeans | 100.0 /100 | #17 | Exceptional 93.0% |
| Welsh | 100.0 /100 | #18 | Exceptional 93.0% |
| Tongans | 100.0 /100 | #19 | Exceptional 92.9% |
Scandinavian 1 or more Vehicles in Household Correlation Summary
| Measurement | Scandinavian Data | 1 or more Vehicles in Household Data |
| Minimum | 0.19% | 88.9% |
| Maximum | 100.0% | 100.0% |
| Range | 99.8% | 11.1% |
| Mean | 23.1% | 97.9% |
| Median | 18.8% | 99.3% |
| Interquartile 25% (IQ1) | 9.0% | 96.4% |
| Interquartile 75% (IQ3) | 30.8% | 100.0% |
| Interquartile Range (IQR) | 21.8% | 3.6% |
| Standard Deviation (Sample) | 19.8% | 2.7% |
| Standard Deviation (Population) | 19.6% | 2.7% |
Correlation Details
| Scandinavian Percentile | Sample Size | 1 or more Vehicles in Household |
[ 0.0% - 0.5% ] 0.19% | 375,607,027 | 90.6% |
[ 0.5% - 1.0% ] 0.70% | 60,090,128 | 94.3% |
[ 1.0% - 1.5% ] 1.22% | 18,930,485 | 94.6% |
[ 1.5% - 2.0% ] 1.73% | 8,427,948 | 94.6% |
[ 2.0% - 2.5% ] 2.21% | 4,761,821 | 95.5% |
[ 2.5% - 3.0% ] 2.73% | 2,338,088 | 95.7% |
[ 3.0% - 3.5% ] 3.21% | 893,626 | 95.4% |
[ 3.5% - 4.0% ] 3.72% | 486,897 | 96.2% |
[ 4.0% - 4.5% ] 4.24% | 197,654 | 95.6% |
[ 4.5% - 5.0% ] 4.74% | 123,911 | 95.5% |
[ 5.0% - 5.5% ] 5.25% | 100,799 | 96.9% |
[ 5.5% - 6.0% ] 5.75% | 111,828 | 95.6% |
[ 6.0% - 6.5% ] 6.27% | 53,828 | 96.3% |
[ 6.5% - 7.0% ] 6.76% | 57,061 | 97.0% |
[ 7.0% - 7.5% ] 7.29% | 32,490 | 96.8% |
[ 7.5% - 8.0% ] 7.71% | 22,983 | 96.5% |
[ 8.0% - 8.5% ] 8.25% | 19,965 | 96.5% |
[ 8.5% - 9.0% ] 8.71% | 14,653 | 96.7% |
[ 9.0% - 9.5% ] 9.23% | 7,642 | 96.9% |
[ 9.5% - 10.0% ] 9.72% | 6,386 | 97.4% |
[ 10.0% - 10.5% ] 10.25% | 13,080 | 93.8% |
[ 10.5% - 11.0% ] 10.74% | 6,174 | 96.7% |
[ 11.0% - 11.5% ] 11.29% | 2,029 | 99.0% |
[ 11.5% - 12.0% ] 11.66% | 2,934 | 98.2% |
[ 12.0% - 12.5% ] 12.27% | 3,725 | 97.5% |
[ 12.5% - 13.0% ] 12.71% | 1,707 | 97.7% |
[ 13.0% - 13.5% ] 13.19% | 614 | 99.0% |
[ 13.5% - 14.0% ] 13.68% | 1,447 | 100.0% |
[ 14.0% - 14.5% ] 14.13% | 4,472 | 97.6% |
[ 14.5% - 15.0% ] 14.58% | 4,726 | 98.5% |
[ 15.0% - 15.5% ] 15.31% | 980 | 89.9% |
[ 15.5% - 16.0% ] 15.71% | 1,470 | 100.0% |
[ 16.0% - 16.5% ] 16.19% | 105 | 96.9% |
[ 16.5% - 17.0% ] 16.60% | 3,874 | 99.3% |
[ 17.0% - 17.5% ] 17.23% | 2,240 | 94.0% |
[ 18.0% - 18.5% ] 18.21% | 2,164 | 99.5% |
[ 18.5% - 19.0% ] 18.78% | 181 | 97.9% |
[ 19.0% - 19.5% ] 19.33% | 150 | 100.0% |
[ 19.5% - 20.0% ] 19.87% | 463 | 100.0% |
[ 20.0% - 20.5% ] 20.10% | 960 | 100.0% |
[ 20.5% - 21.0% ] 20.80% | 524 | 100.0% |
[ 21.0% - 21.5% ] 21.27% | 489 | 100.0% |
[ 21.5% - 22.0% ] 21.83% | 1,663 | 99.9% |
[ 22.0% - 22.5% ] 22.10% | 534 | 100.0% |
[ 22.5% - 23.0% ] 22.78% | 259 | 92.8% |
[ 23.0% - 23.5% ] 23.40% | 47 | 100.0% |
[ 23.5% - 24.0% ] 23.81% | 21 | 88.9% |
[ 24.0% - 24.5% ] 24.32% | 37 | 100.0% |
[ 25.5% - 26.0% ] 25.58% | 215 | 100.0% |
[ 26.0% - 26.5% ] 26.09% | 46 | 100.0% |
[ 26.5% - 27.0% ] 26.86% | 1,627 | 100.0% |
[ 27.0% - 27.5% ] 27.32% | 388 | 100.0% |
[ 28.0% - 28.5% ] 28.03% | 603 | 91.9% |
[ 28.5% - 29.0% ] 28.57% | 28 | 100.0% |
[ 30.0% - 30.5% ] 30.23% | 311 | 100.0% |
[ 31.0% - 31.5% ] 31.37% | 255 | 100.0% |
[ 32.0% - 32.5% ] 32.14% | 672 | 100.0% |
[ 33.0% - 33.5% ] 33.33% | 30 | 100.0% |
[ 35.5% - 36.0% ] 35.63% | 87 | 100.0% |
[ 37.0% - 37.5% ] 37.50% | 16 | 100.0% |
[ 37.5% - 38.0% ] 37.79% | 217 | 100.0% |
[ 39.0% - 39.5% ] 39.10% | 156 | 100.0% |
[ 41.5% - 42.0% ] 41.90% | 179 | 100.0% |
[ 43.0% - 43.5% ] 43.27% | 312 | 100.0% |
[ 47.0% - 47.5% ] 47.06% | 51 | 100.0% |
[ 48.0% - 48.5% ] 48.49% | 299 | 100.0% |
[ 51.0% - 51.5% ] 51.35% | 37 | 100.0% |
[ 52.0% - 52.5% ] 52.27% | 88 | 100.0% |
[ 66.5% - 67.0% ] 66.67% | 87 | 100.0% |
[ 69.5% - 70.0% ] 69.93% | 153 | 100.0% |
[ 71.0% - 71.5% ] 71.43% | 42 | 100.0% |
[ 75.0% - 75.5% ] 75.31% | 81 | 100.0% |
[ 99.5% - 100.0% ] 100.00% | 58 | 100.0% |