Cree 1 or more Vehicles in Household

COMPARE

Cree
Race
Ancestry
AfghanAfricanAlaska NativeAlaskan AthabascanAlbanianAleutAlsatianAmericanApacheArabArapahoArgentineanArmenianAssyrian/Chaldean/SyriacAustralianAustrianBahamianBangladeshiBarbadianBasqueBelgianBelizeanBermudanBhutaneseBlackfeetBolivianBrazilianBritishBritish West IndianBulgarianBurmeseCajunCambodianCanadianCape VerdeanCarpatho RusynCelticCentral AmericanCentral American IndianCherokeeCheyenneChickasawChileanChineseChippewaChoctawColombianColvilleComancheCosta RicanCreeCreekCroatianCrowCubanCypriotCzechCzechoslovakianDanishDelawareDominicanDutchDutch West IndianEastern EuropeanEcuadorianEgyptianEnglishEstonianEthiopianEuropeanFijianFilipinoFinnishFrenchFrench American IndianFrench CanadianGermanGerman RussianGhanaianGreekGuamanian/ChamorroGuatemalanGuyaneseHaitianHmongHonduranHopiHoumaHungarianIcelanderIndian (Asian)IndonesianInupiatIranianIraqiIrishIroquoisIsraeliItalianJamaicanJapaneseJordanianKenyanKiowaKoreanLaotianLatvianLebaneseLiberianLithuanianLumbeeLuxembourgerMacedonianMalaysianMalteseMarshalleseMenomineeMexicanMexican American IndianMongolianMoroccanNative HawaiianNavajoNepaleseNew ZealanderNicaraguanNigerianNorthern EuropeanNorwegianOkinawanOsageOttawaPaiutePakistaniPalestinianPanamanianParaguayanPennsylvania GermanPeruvianPimaPolishPortuguesePotawatomiPuebloPuerto RicanPuget Sound SalishRomanianRussianSalvadoranSamoanScandinavianScotch-IrishScottishSeminoleSenegaleseSerbianShoshoneSierra LeoneanSiouxSlavicSlovakSloveneSomaliSouth AfricanSouth AmericanSouth American IndianSoviet UnionSpaniardSpanishSpanish AmericanSpanish American IndianSri LankanSubsaharan AfricanSudaneseSwedishSwissSyrianTaiwaneseThaiTlingit-HaidaTohono O'OdhamTonganTrinidadian and TobagonianTsimshianTurkishU.S. Virgin IslanderUgandanUkrainianUruguayanUteVenezuelanVietnameseWelshWest IndianYakamaYaquiYugoslavianYumanYup'ikZimbabwean
Immigration
NonimmigrantsImmigrantsAfghanistanAfricaAlbaniaArgentinaArmeniaAsiaAustraliaAustriaBahamasBangladeshBarbadosBelarusBelgiumBelizeBoliviaBosnia and HerzegovinaBrazilBulgariaBurma/MyanmarCabo VerdeCambodiaCameroonCanadaCaribbeanCentral AmericaChileChinaColombiaCongoCosta RicaCroatiaCubaCzechoslovakiaDenmarkDominicaDominican RepublicEastern AfricaEastern AsiaEastern EuropeEcuadorEgyptEl SalvadorEnglandEritreaEthiopiaEuropeFijiFranceGermanyGhanaGreeceGrenadaGuatemalaGuyanaHaitiHondurasHong KongHungaryIndiaIndonesiaIranIraqIrelandIsraelItalyJamaicaJapanJordanKazakhstanKenyaKoreaKuwaitLaosLatin AmericaLatviaLebanonLiberiaLithuaniaMalaysiaMexicoMicronesiaMiddle AfricaMoldovaMoroccoNepalNetherlandsNicaraguaNigeriaNorth AmericaNorth MacedoniaNorthern AfricaNorthern EuropeNorwayOceaniaPakistanPanamaPeruPhilippinesPolandPortugalRomaniaRussiaSaudi ArabiaScotlandSenegalSerbiaSierra LeoneSingaporeSomaliaSouth AfricaSouth AmericaSouth Central AsiaSouth Eastern AsiaSouthern EuropeSpainSri LankaSt. Vincent and the GrenadinesSudanSwedenSwitzerlandSyriaTaiwanThailandTrinidad and TobagoTurkeyUgandaUkraineUruguayUzbekistanVenezuelaVietnamWest IndiesWestern AfricaWestern AsiaWestern EuropeYemenZaireZimbabweAzores
Select to Compare
Race
Ancestry
AfghanAfricanAlaska NativeAlaskan AthabascanAlbanianAleutAlsatianAmericanApacheArabArapahoArgentineanArmenianAssyrian/Chaldean/SyriacAustralianAustrianBahamianBangladeshiBarbadianBasqueBelgianBelizeanBermudanBhutaneseBlackfeetBolivianBrazilianBritishBritish West IndianBulgarianBurmeseCajunCambodianCanadianCape VerdeanCarpatho RusynCelticCentral AmericanCentral American IndianCherokeeCheyenneChickasawChileanChineseChippewaChoctawColombianColvilleComancheCosta RicanCreekCroatianCrowCubanCypriotCzechCzechoslovakianDanishDelawareDominicanDutchDutch West IndianEastern EuropeanEcuadorianEgyptianEnglishEstonianEthiopianEuropeanFijianFilipinoFinnishFrenchFrench American IndianFrench CanadianGermanGerman RussianGhanaianGreekGuamanian/ChamorroGuatemalanGuyaneseHaitianHmongHonduranHopiHoumaHungarianIcelanderIndian (Asian)IndonesianInupiatIranianIraqiIrishIroquoisIsraeliItalianJamaicanJapaneseJordanianKenyanKiowaKoreanLaotianLatvianLebaneseLiberianLithuanianLumbeeLuxembourgerMacedonianMalaysianMalteseMarshalleseMenomineeMexicanMexican American IndianMongolianMoroccanNative HawaiianNavajoNepaleseNew ZealanderNicaraguanNigerianNorthern EuropeanNorwegianOkinawanOsageOttawaPaiutePakistaniPalestinianPanamanianParaguayanPennsylvania GermanPeruvianPimaPolishPortuguesePotawatomiPuebloPuerto RicanPuget Sound SalishRomanianRussianSalvadoranSamoanScandinavianScotch-IrishScottishSeminoleSenegaleseSerbianShoshoneSierra LeoneanSiouxSlavicSlovakSloveneSomaliSouth AfricanSouth AmericanSouth American IndianSoviet UnionSpaniardSpanishSpanish AmericanSpanish American IndianSri LankanSubsaharan AfricanSudaneseSwedishSwissSyrianTaiwaneseThaiTlingit-HaidaTohono O'OdhamTonganTrinidadian and TobagonianTsimshianTurkishU.S. Virgin IslanderUgandanUkrainianUruguayanUteVenezuelanVietnameseWelshWest IndianYakamaYaquiYugoslavianYumanYup'ikZimbabwean
Immigration
NonimmigrantsImmigrantsAfghanistanAfricaAlbaniaArgentinaArmeniaAsiaAustraliaAustriaBahamasBangladeshBarbadosBelarusBelgiumBelizeBoliviaBosnia and HerzegovinaBrazilBulgariaBurma/MyanmarCabo VerdeCambodiaCameroonCanadaCaribbeanCentral AmericaChileChinaColombiaCongoCosta RicaCroatiaCubaCzechoslovakiaDenmarkDominicaDominican RepublicEastern AfricaEastern AsiaEastern EuropeEcuadorEgyptEl SalvadorEnglandEritreaEthiopiaEuropeFijiFranceGermanyGhanaGreeceGrenadaGuatemalaGuyanaHaitiHondurasHong KongHungaryIndiaIndonesiaIranIraqIrelandIsraelItalyJamaicaJapanJordanKazakhstanKenyaKoreaKuwaitLaosLatin AmericaLatviaLebanonLiberiaLithuaniaMalaysiaMexicoMicronesiaMiddle AfricaMoldovaMoroccoNepalNetherlandsNicaraguaNigeriaNorth AmericaNorth MacedoniaNorthern AfricaNorthern EuropeNorwayOceaniaPakistanPanamaPeruPhilippinesPolandPortugalRomaniaRussiaSaudi ArabiaScotlandSenegalSerbiaSierra LeoneSingaporeSomaliaSouth AfricaSouth AmericaSouth Central AsiaSouth Eastern AsiaSouthern EuropeSpainSri LankaSt. Vincent and the GrenadinesSudanSwedenSwitzerlandSyriaTaiwanThailandTrinidad and TobagoTurkeyUgandaUkraineUruguayUzbekistanVenezuelaVietnamWest IndiesWestern AfricaWestern AsiaWestern EuropeYemenZaireZimbabweAzores
1 or more Vehicles in Household
Income
Poverty
Unemployment
Labor Participation
Family Structure
Vehicle Availability
Education Level
Disability

Cree 1 or more Vehicles in Household
Tragic

88.7%
1+ VEHICLES AVAILABLE
6.0/ 100
METRIC RATING
225th/ 347
METRIC RANK

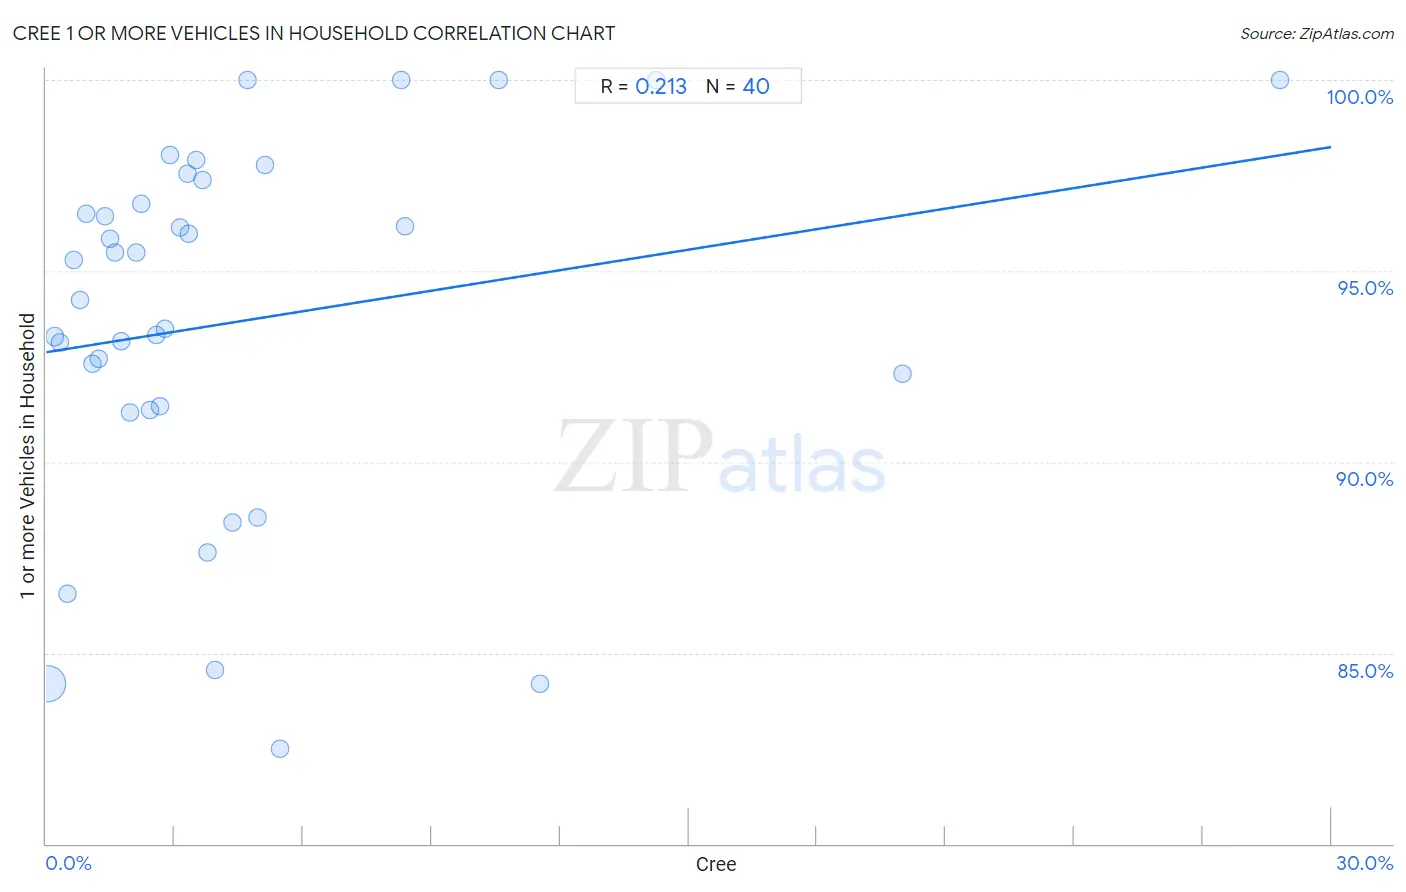
Cree 1 or more Vehicles in Household Correlation Chart

The statistical analysis conducted on geographies consisting of 76,210,304 people shows a weak positive correlation between the proportion of Cree and percentage of households with 1 or more vehicles available in the United States with a correlation coefficient (R) of 0.213 and weighted average of 88.7%. On average, for every 1% (one percent) increase in Cree within a typical geography, there is an increase of 0.18% in percentage of households with 1 or more vehicles available.
Cree 1 or more Vehicles in Household
It is essential to understand that the correlation between the percentage of Cree and percentage of households with 1 or more vehicles available does not imply a direct cause-and-effect relationship. It remains uncertain whether the presence of Cree influences an upward or downward trend in the level of percentage of households with 1 or more vehicles available within an area, or if Cree simply ended up residing in those areas with higher or lower levels of percentage of households with 1 or more vehicles available due to other factors.

Demographics Similar to Cree by 1 or more Vehicles in Household

In terms of 1 or more vehicles in household, the demographic groups most similar to Cree are Immigrants from Hong Kong (88.7%, a difference of 0.010%), Cheyenne (88.7%, a difference of 0.030%), Ute (88.7%, a difference of 0.030%), Immigrants from Norway (88.7%, a difference of 0.040%), and Immigrants from Romania (88.7%, a difference of 0.050%).
DemographicsRating | Rank1 or more Vehicles in Household
Ugandans
8.7
/100
|
#218
Tragic
88.9%
Immigrants from Guatemala
8.6
/100
|
#219
Tragic
88.9%
Immigrants from Zaire
8.1
/100
|
#220
Tragic
88.8%
Peruvians
7.9
/100
|
#221
Tragic
88.8%
Uruguayans
7.0
/100
|
#222
Tragic
88.8%
Immigrants from South America
7.0
/100
|
#223
Tragic
88.8%
Immigrants from Hong Kong
6.2
/100
|
#224
Tragic
88.7%
Cree
6.0
/100
|
#225
Tragic
88.7%
Cheyenne
5.7
/100
|
#226
Tragic
88.7%
Ute
5.6
/100
|
#227
Tragic
88.7%
Immigrants from Norway
5.5
/100
|
#228
Tragic
88.7%
Immigrants from Romania
5.4
/100
|
#229
Tragic
88.7%
Immigrants from Sierra Leone
5.2
/100
|
#230
Tragic
88.7%
Russians
5.0
/100
|
#231
Tragic
88.7%
Immigrants from Japan
4.9
/100
|
#232
Tragic
88.7%

Cree 1 or more Vehicles in Household Correlation Summary

MeasurementCree Data1 or more Vehicles in Household Data
Minimum0.016%82.5%
Maximum28.8%100.0%
Range28.8%17.5%
Mean4.6%93.7%
Median2.8%94.8%
Interquartile 25% (IQ1)1.4%91.4%
Interquartile 75% (IQ3)4.8%97.1%
Interquartile Range (IQR)3.4%5.7%
Standard Deviation (Sample)5.7%4.8%
Standard Deviation (Population)5.6%4.7%

Correlation Details

Cree PercentileSample Size1 or more Vehicles in Household
[
0.0%
-
0.5%
]
0.016%
72,697,89384.2%
[
0.0%
-
0.5%
]
0.19%
2,206,46493.3%
[
0.0%
-
0.5%
]
0.33%
618,03793.1%
[
0.0%
-
0.5%
]
0.49%
319,75286.6%
[
0.5%
-
1.0%
]
0.65%
86,12195.3%
[
0.5%
-
1.0%
]
0.77%
91,11994.2%
[
0.5%
-
1.0%
]
0.93%
36,30496.5%
[
1.0%
-
1.5%
]
1.08%
7,34592.6%
[
1.0%
-
1.5%
]
1.21%
19,69992.7%
[
1.0%
-
1.5%
]
1.36%
22,91096.4%
[
1.0%
-
1.5%
]
1.49%
14,93095.8%
[
1.5%
-
2.0%
]
1.60%
33,78095.5%
[
1.5%
-
2.0%
]
1.75%
4,74193.2%
[
1.5%
-
2.0%
]
1.95%
9,71191.3%
[
2.0%
-
2.5%
]
2.10%
1,52495.5%
[
2.0%
-
2.5%
]
2.23%
3,49496.8%
[
2.0%
-
2.5%
]
2.42%
3,22591.4%
[
2.5%
-
3.0%
]
2.56%
23493.3%
[
2.5%
-
3.0%
]
2.67%
6,14691.4%
[
2.5%
-
3.0%
]
2.76%
1,01593.5%
[
2.5%
-
3.0%
]
2.89%
69398.0%
[
3.0%
-
3.5%
]
3.13%
4,11896.2%
[
3.0%
-
3.5%
]
3.30%
3,81397.5%
[
3.0%
-
3.5%
]
3.34%
59996.0%
[
3.5%
-
4.0%
]
3.51%
1,82597.9%
[
3.5%
-
4.0%
]
3.64%
1,40397.4%
[
3.5%
-
4.0%
]
3.77%
21287.6%
[
3.5%
-
4.0%
]
3.93%
78984.6%
[
4.0%
-
4.5%
]
4.35%
68988.4%
[
4.5%
-
5.0%
]
4.69%
469100.0%
[
4.5%
-
5.0%
]
4.93%
69088.5%
[
5.0%
-
5.5%
]
5.10%
2,62997.8%
[
5.0%
-
5.5%
]
5.46%
3,66282.5%
[
8.0%
-
8.5%
]
8.30%
265100.0%
[
8.0%
-
8.5%
]
8.38%
1,59996.2%
[
10.5%
-
11.0%
]
10.57%
577100.0%
[
11.5%
-
12.0%
]
11.53%
93784.2%
[
14.0%
-
14.5%
]
14.25%
772100.0%
[
20.0%
-
20.5%
]
20.00%
6092.3%
[
28.5%
-
29.0%
]
28.81%
59100.0%