Subsaharan African 3 or more Vehicles in Household
COMPARE
Subsaharan African
Select to Compare
3 or more Vehicles in Household
Subsaharan African 3 or more Vehicles in Household
17.9%
3+ VEHICLES AVAILABLE
1.1/ 100
METRIC RATING
256th/ 347
METRIC RANK
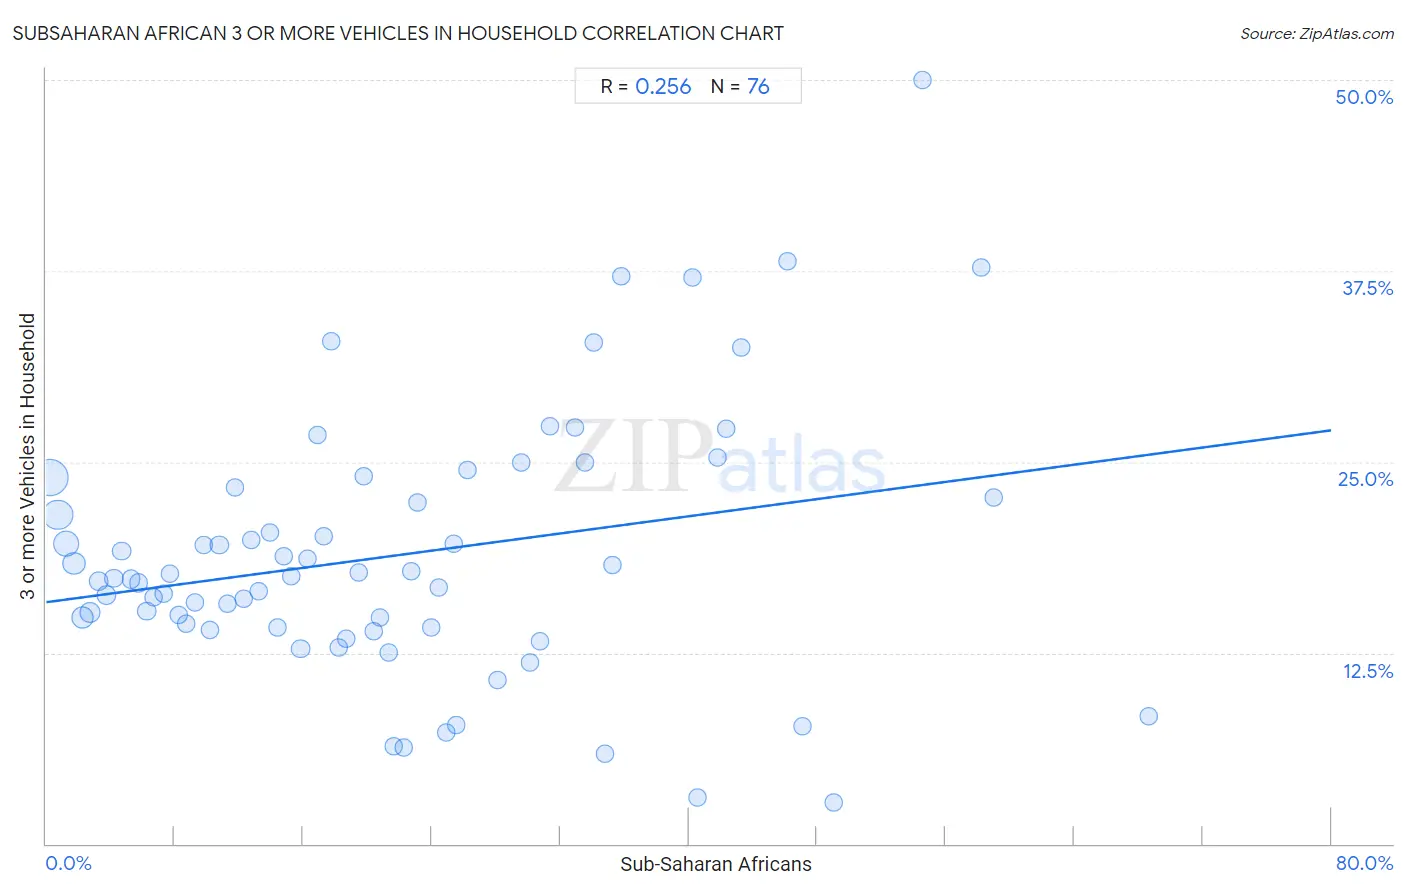
Subsaharan African 3 or more Vehicles in Household Correlation Chart
The statistical analysis conducted on geographies consisting of 507,393,924 people shows a weak positive correlation between the proportion of Sub-Saharan Africans and percentage of households with 3 or more vehicles available in the United States with a correlation coefficient (R) of 0.256 and weighted average of 17.9%. On average, for every 1% (one percent) increase in Sub-Saharan Africans within a typical geography, there is an increase of 0.14% in percentage of households with 3 or more vehicles available.
It is essential to understand that the correlation between the percentage of Sub-Saharan Africans and percentage of households with 3 or more vehicles available does not imply a direct cause-and-effect relationship. It remains uncertain whether the presence of Sub-Saharan Africans influences an upward or downward trend in the level of percentage of households with 3 or more vehicles available within an area, or if Sub-Saharan Africans simply ended up residing in those areas with higher or lower levels of percentage of households with 3 or more vehicles available due to other factors.
Demographics Similar to Sub-Saharan Africans by 3 or more Vehicles in Household
In terms of 3 or more vehicles in household, the demographic groups most similar to Sub-Saharan Africans are Immigrants from Eritrea (17.8%, a difference of 0.050%), Sudanese (17.8%, a difference of 0.050%), Immigrants from Turkey (17.9%, a difference of 0.15%), Ethiopian (17.9%, a difference of 0.18%), and Immigrants from Ethiopia (17.9%, a difference of 0.19%).
| Demographics | Rating | Rank | 3 or more Vehicles in Household |
| Immigrants from Saudi Arabia | 1.7 /100 | #249 | Tragic 18.0% |
| Venezuelans | 1.7 /100 | #250 | Tragic 18.0% |
| Alsatians | 1.5 /100 | #251 | Tragic 18.0% |
| Immigrants from Southern Europe | 1.4 /100 | #252 | Tragic 17.9% |
| Immigrants from Ethiopia | 1.3 /100 | #253 | Tragic 17.9% |
| Ethiopians | 1.2 /100 | #254 | Tragic 17.9% |
| Immigrants from Turkey | 1.2 /100 | #255 | Tragic 17.9% |
| Sub-Saharan Africans | 1.1 /100 | #256 | Tragic 17.9% |
| Immigrants from Eritrea | 1.1 /100 | #257 | Tragic 17.8% |
| Sudanese | 1.1 /100 | #258 | Tragic 17.8% |
| Uruguayans | 1.0 /100 | #259 | Tragic 17.8% |
| Ugandans | 0.9 /100 | #260 | Tragic 17.8% |
| Immigrants from Northern Africa | 0.9 /100 | #261 | Tragic 17.8% |
| Colombians | 0.9 /100 | #262 | Tragic 17.8% |
| Bermudans | 0.9 /100 | #263 | Tragic 17.8% |
Subsaharan African 3 or more Vehicles in Household Correlation Summary
| Measurement | Subsaharan African Data | 3 or more Vehicles in Household Data |
| Minimum | 0.24% | 2.7% |
| Maximum | 68.6% | 50.0% |
| Range | 68.4% | 47.3% |
| Mean | 21.7% | 18.9% |
| Median | 19.0% | 17.4% |
| Interquartile 25% (IQ1) | 9.5% | 14.2% |
| Interquartile 75% (IQ3) | 31.0% | 23.0% |
| Interquartile Range (IQR) | 21.5% | 8.9% |
| Standard Deviation (Sample) | 15.6% | 8.6% |
| Standard Deviation (Population) | 15.5% | 8.5% |
Correlation Details
| Subsaharan African Percentile | Sample Size | 3 or more Vehicles in Household |
[ 0.0% - 0.5% ] 0.24% | 172,274,061 | 23.9% |
[ 0.5% - 1.0% ] 0.72% | 106,890,586 | 21.5% |
[ 1.0% - 1.5% ] 1.24% | 70,580,837 | 19.6% |
[ 1.5% - 2.0% ] 1.73% | 41,209,591 | 18.4% |
[ 2.0% - 2.5% ] 2.25% | 34,270,668 | 14.8% |
[ 2.5% - 3.0% ] 2.73% | 23,386,585 | 15.1% |
[ 3.0% - 3.5% ] 3.23% | 13,222,654 | 17.2% |
[ 3.5% - 4.0% ] 3.75% | 9,285,996 | 16.3% |
[ 4.0% - 4.5% ] 4.22% | 8,846,183 | 17.4% |
[ 4.5% - 5.0% ] 4.71% | 4,058,055 | 19.2% |
[ 5.0% - 5.5% ] 5.29% | 3,769,030 | 17.3% |
[ 5.5% - 6.0% ] 5.77% | 3,289,631 | 17.1% |
[ 6.0% - 6.5% ] 6.26% | 2,200,977 | 15.2% |
[ 6.5% - 7.0% ] 6.66% | 2,512,399 | 16.1% |
[ 7.0% - 7.5% ] 7.34% | 1,485,032 | 16.4% |
[ 7.5% - 8.0% ] 7.73% | 1,546,055 | 17.6% |
[ 8.0% - 8.5% ] 8.23% | 988,922 | 15.0% |
[ 8.5% - 9.0% ] 8.72% | 992,285 | 14.4% |
[ 9.0% - 9.5% ] 9.27% | 864,983 | 15.8% |
[ 9.5% - 10.0% ] 9.78% | 411,318 | 19.6% |
[ 10.0% - 10.5% ] 10.22% | 750,682 | 14.0% |
[ 10.5% - 11.0% ] 10.78% | 528,442 | 19.6% |
[ 11.0% - 11.5% ] 11.27% | 653,092 | 15.7% |
[ 11.5% - 12.0% ] 11.75% | 279,205 | 23.3% |
[ 12.0% - 12.5% ] 12.27% | 101,169 | 16.1% |
[ 12.5% - 13.0% ] 12.77% | 185,037 | 19.9% |
[ 13.0% - 13.5% ] 13.23% | 438,997 | 16.5% |
[ 13.5% - 14.0% ] 13.91% | 351,481 | 20.4% |
[ 14.0% - 14.5% ] 14.38% | 83,868 | 14.2% |
[ 14.5% - 15.0% ] 14.81% | 134,736 | 18.8% |
[ 15.0% - 15.5% ] 15.22% | 236,677 | 17.5% |
[ 15.5% - 16.0% ] 15.84% | 217,851 | 12.7% |
[ 16.0% - 16.5% ] 16.25% | 194,496 | 18.6% |
[ 16.5% - 17.0% ] 16.91% | 30,595 | 26.8% |
[ 17.0% - 17.5% ] 17.26% | 144,397 | 20.1% |
[ 17.5% - 18.0% ] 17.73% | 65,899 | 32.9% |
[ 18.0% - 18.5% ] 18.20% | 221,308 | 12.8% |
[ 18.5% - 19.0% ] 18.66% | 97,301 | 13.5% |
[ 19.0% - 19.5% ] 19.43% | 243,304 | 17.7% |
[ 19.5% - 20.0% ] 19.74% | 20,175 | 24.1% |
[ 20.0% - 20.5% ] 20.42% | 36,389 | 13.9% |
[ 20.5% - 21.0% ] 20.76% | 30,497 | 14.8% |
[ 21.0% - 21.5% ] 21.30% | 28,219 | 12.6% |
[ 21.5% - 22.0% ] 21.65% | 54,524 | 6.4% |
[ 22.0% - 22.5% ] 22.26% | 283 | 6.3% |
[ 22.5% - 23.0% ] 22.71% | 52,239 | 17.9% |
[ 23.0% - 23.5% ] 23.08% | 208 | 22.3% |
[ 23.5% - 24.0% ] 23.99% | 14,553 | 14.1% |
[ 24.0% - 24.5% ] 24.43% | 25,424 | 16.8% |
[ 24.5% - 25.0% ] 24.86% | 370 | 7.3% |
[ 25.0% - 25.5% ] 25.38% | 658 | 19.6% |
[ 25.5% - 26.0% ] 25.54% | 881 | 7.8% |
[ 26.0% - 26.5% ] 26.24% | 2,138 | 24.5% |
[ 28.0% - 28.5% ] 28.06% | 29,898 | 10.7% |
[ 29.5% - 30.0% ] 29.55% | 44 | 25.0% |
[ 30.0% - 30.5% ] 30.14% | 2,037 | 11.9% |
[ 30.5% - 31.0% ] 30.74% | 15,489 | 13.2% |
[ 31.0% - 31.5% ] 31.35% | 2,485 | 27.3% |
[ 32.5% - 33.0% ] 32.93% | 334 | 27.3% |
[ 33.5% - 34.0% ] 33.53% | 173 | 25.0% |
[ 34.0% - 34.5% ] 34.07% | 3,824 | 32.8% |
[ 34.5% - 35.0% ] 34.78% | 46 | 5.9% |
[ 35.0% - 35.5% ] 35.23% | 1,286 | 18.3% |
[ 35.5% - 36.0% ] 35.82% | 67 | 37.1% |
[ 40.0% - 40.5% ] 40.22% | 4,572 | 37.1% |
[ 40.5% - 41.0% ] 40.56% | 9,613 | 3.0% |
[ 41.5% - 42.0% ] 41.76% | 613 | 25.3% |
[ 42.0% - 42.5% ] 42.31% | 338 | 27.2% |
[ 43.0% - 43.5% ] 43.29% | 633 | 32.5% |
[ 46.0% - 46.5% ] 46.15% | 78 | 38.1% |
[ 47.0% - 47.5% ] 47.10% | 1,157 | 7.7% |
[ 49.0% - 49.5% ] 49.02% | 9,074 | 2.7% |
[ 54.5% - 55.0% ] 54.55% | 11 | 50.0% |
[ 58.0% - 58.5% ] 58.19% | 574 | 37.7% |
[ 59.0% - 59.5% ] 59.02% | 549 | 22.7% |
[ 68.5% - 69.0% ] 68.60% | 86 | 8.3% |