Crow 1 or more Vehicles in Household
COMPARE
Crow
Select to Compare
1 or more Vehicles in Household
Crow 1 or more Vehicles in Household
89.3%
1+ VEHICLES AVAILABLE
24.3/ 100
METRIC RATING
196th/ 347
METRIC RANK
Crow 1 or more Vehicles in Household Correlation Chart
The statistical analysis conducted on geographies consisting of 59,203,156 people shows a poor positive correlation between the proportion of Crow and percentage of households with 1 or more vehicles available in the United States with a correlation coefficient (R) of 0.137 and weighted average of 89.3%. On average, for every 1% (one percent) increase in Crow within a typical geography, there is an increase of 0.024% in percentage of households with 1 or more vehicles available.
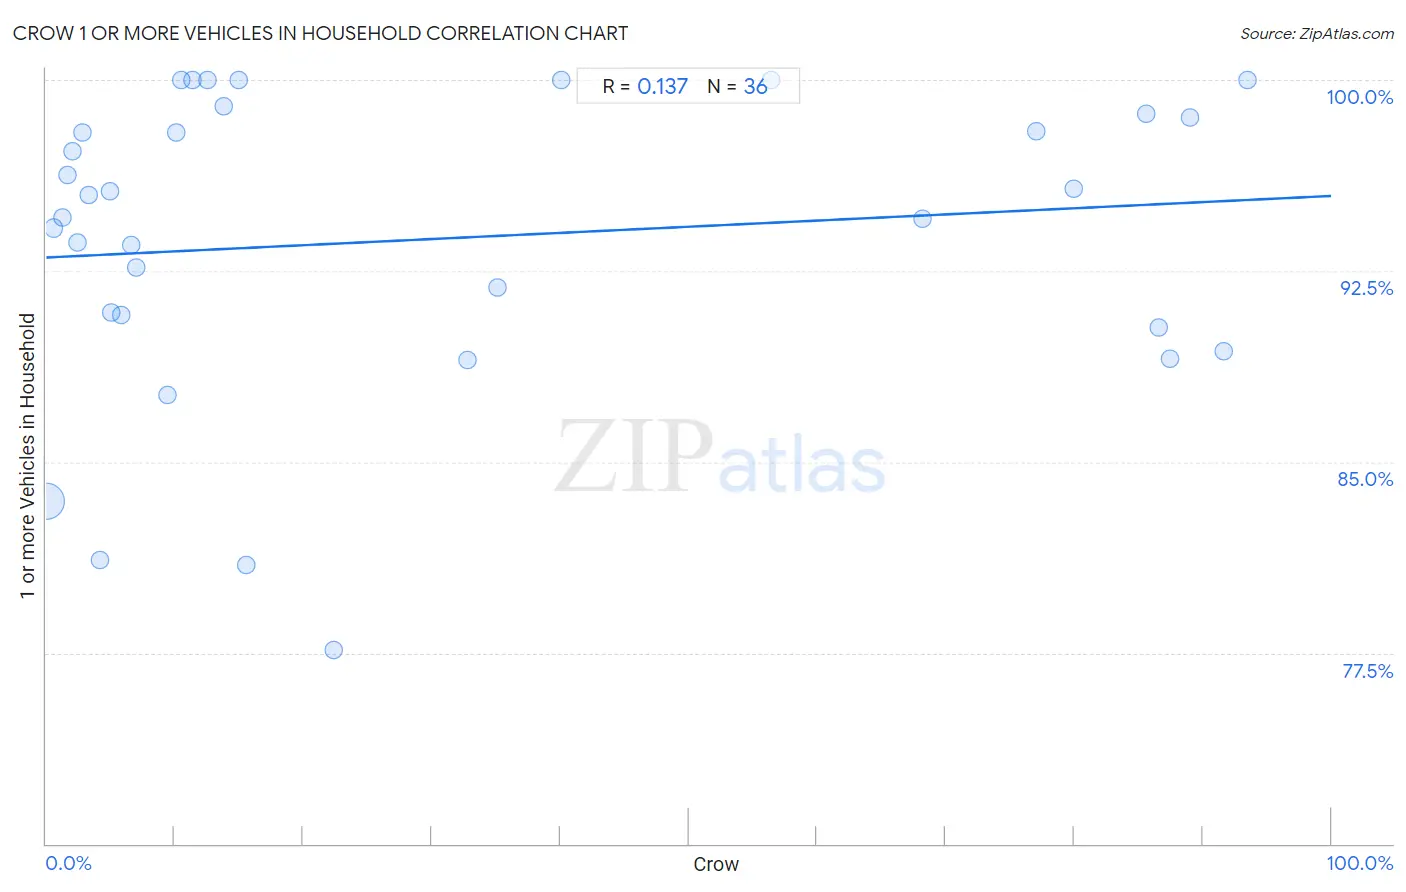
It is essential to understand that the correlation between the percentage of Crow and percentage of households with 1 or more vehicles available does not imply a direct cause-and-effect relationship. It remains uncertain whether the presence of Crow influences an upward or downward trend in the level of percentage of households with 1 or more vehicles available within an area, or if Crow simply ended up residing in those areas with higher or lower levels of percentage of households with 1 or more vehicles available due to other factors.
Demographics Similar to Crow by 1 or more Vehicles in Household
In terms of 1 or more vehicles in household, the demographic groups most similar to Crow are Immigrants from Sweden (89.3%, a difference of 0.010%), Pennsylvania German (89.3%, a difference of 0.030%), Immigrants from Asia (89.3%, a difference of 0.030%), Central American (89.2%, a difference of 0.060%), and Immigrants from Western Europe (89.2%, a difference of 0.090%).
| Demographics | Rating | Rank | 1 or more Vehicles in Household |
| Carpatho Rusyns | 37.8 /100 | #189 | Fair 89.5% |
| Shoshone | 37.5 /100 | #190 | Fair 89.5% |
| Immigrants from Poland | 37.1 /100 | #191 | Fair 89.5% |
| Immigrants from North Macedonia | 36.5 /100 | #192 | Fair 89.5% |
| Immigrants from Northern Europe | 35.5 /100 | #193 | Fair 89.5% |
| Immigrants from Eritrea | 33.2 /100 | #194 | Fair 89.4% |
| Immigrants from Armenia | 31.8 /100 | #195 | Fair 89.4% |
| Crow | 24.3 /100 | #196 | Fair 89.3% |
| Immigrants from Sweden | 23.6 /100 | #197 | Fair 89.3% |
| Pennsylvania Germans | 22.9 /100 | #198 | Fair 89.3% |
| Immigrants from Asia | 22.8 /100 | #199 | Fair 89.3% |
| Central Americans | 21.4 /100 | #200 | Fair 89.2% |
| Immigrants from Western Europe | 20.5 /100 | #201 | Fair 89.2% |
| Iroquois | 19.8 /100 | #202 | Poor 89.2% |
| Cambodians | 18.9 /100 | #203 | Poor 89.2% |
Crow 1 or more Vehicles in Household Correlation Summary
| Measurement | Crow Data | 1 or more Vehicles in Household Data |
| Minimum | 0.023% | 77.6% |
| Maximum | 93.4% | 100.0% |
| Range | 93.4% | 22.4% |
| Mean | 30.3% | 93.8% |
| Median | 11.9% | 95.0% |
| Interquartile 25% (IQ1) | 4.6% | 90.5% |
| Interquartile 75% (IQ3) | 62.3% | 98.6% |
| Interquartile Range (IQR) | 57.7% | 8.1% |
| Standard Deviation (Sample) | 34.0% | 6.0% |
| Standard Deviation (Population) | 33.5% | 5.9% |
Correlation Details
| Crow Percentile | Sample Size | 1 or more Vehicles in Household |
[ 0.0% - 0.5% ] 0.023% | 58,539,702 | 83.4% |
[ 0.5% - 1.0% ] 0.59% | 293,509 | 94.2% |
[ 1.0% - 1.5% ] 1.26% | 166,103 | 94.6% |
[ 1.5% - 2.0% ] 1.61% | 93,100 | 96.3% |
[ 2.0% - 2.5% ] 2.07% | 7,192 | 97.2% |
[ 2.0% - 2.5% ] 2.45% | 49,253 | 93.6% |
[ 2.5% - 3.0% ] 2.87% | 2,129 | 97.9% |
[ 3.0% - 3.5% ] 3.26% | 11,598 | 95.5% |
[ 4.0% - 4.5% ] 4.23% | 1,560 | 81.1% |
[ 4.5% - 5.0% ] 4.97% | 5,276 | 95.6% |
[ 5.0% - 5.5% ] 5.10% | 1,019 | 90.9% |
[ 5.5% - 6.0% ] 5.79% | 1,796 | 90.8% |
[ 6.5% - 7.0% ] 6.61% | 4,223 | 93.5% |
[ 7.0% - 7.5% ] 7.01% | 785 | 92.6% |
[ 9.0% - 9.5% ] 9.45% | 2,064 | 87.6% |
[ 10.0% - 10.5% ] 10.08% | 2,817 | 97.9% |
[ 10.5% - 11.0% ] 10.53% | 190 | 100.0% |
[ 11.0% - 11.5% ] 11.36% | 176 | 100.0% |
[ 12.0% - 12.5% ] 12.50% | 48 | 100.0% |
[ 13.5% - 14.0% ] 13.79% | 428 | 99.0% |
[ 15.0% - 15.5% ] 15.00% | 40 | 100.0% |
[ 15.5% - 16.0% ] 15.56% | 1,125 | 81.0% |
[ 22.0% - 22.5% ] 22.35% | 783 | 77.6% |
[ 32.5% - 33.0% ] 32.75% | 3,985 | 89.0% |
[ 35.0% - 35.5% ] 35.12% | 5,199 | 91.8% |
[ 40.0% - 40.5% ] 40.12% | 172 | 100.0% |
[ 56.0% - 56.5% ] 56.41% | 78 | 100.0% |
[ 68.0% - 68.5% ] 68.23% | 576 | 94.6% |
[ 77.0% - 77.5% ] 77.09% | 1,602 | 98.0% |
[ 79.5% - 80.0% ] 79.96% | 459 | 95.7% |
[ 85.5% - 86.0% ] 85.61% | 660 | 98.7% |
[ 86.5% - 87.0% ] 86.61% | 2,180 | 90.3% |
[ 87.0% - 87.5% ] 87.40% | 262 | 89.0% |
[ 89.0% - 89.5% ] 89.03% | 629 | 98.6% |
[ 91.5% - 92.0% ] 91.65% | 1,965 | 89.4% |
[ 93.0% - 93.5% ] 93.45% | 473 | 100.0% |