Immigrants from Bosnia and Herzegovina 1 or more Vehicles in Household
COMPARE
Immigrants from Bosnia and Herzegovina
Select to Compare
1 or more Vehicles in Household
Immigrants from Bosnia and Herzegovina 1 or more Vehicles in Household
90.1%
1+ VEHICLES AVAILABLE
75.4/ 100
METRIC RATING
151st/ 347
METRIC RANK
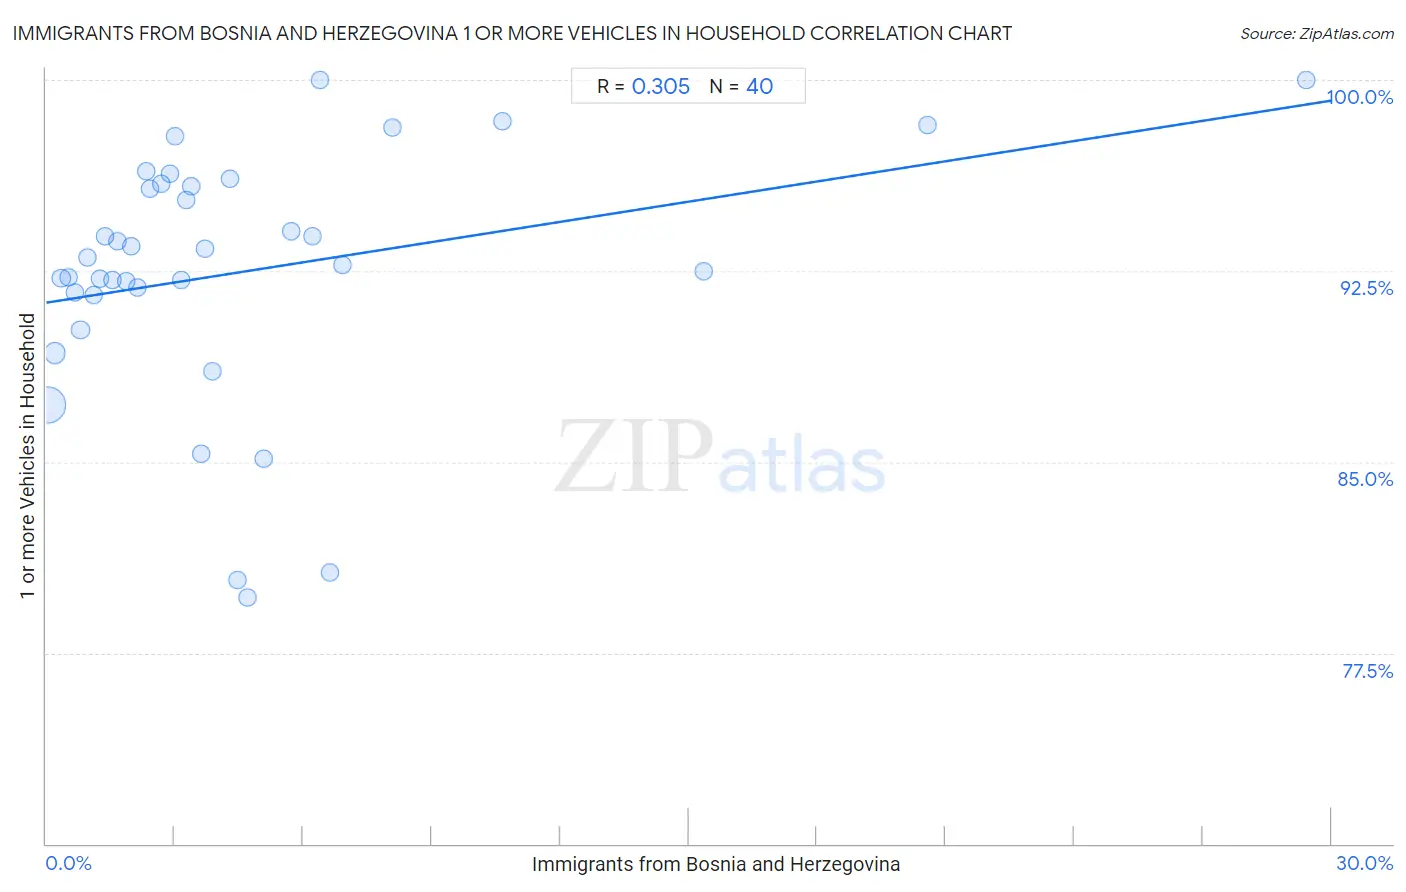
Immigrants from Bosnia and Herzegovina 1 or more Vehicles in Household Correlation Chart
The statistical analysis conducted on geographies consisting of 156,805,510 people shows a mild positive correlation between the proportion of Immigrants from Bosnia and Herzegovina and percentage of households with 1 or more vehicles available in the United States with a correlation coefficient (R) of 0.305 and weighted average of 90.1%. On average, for every 1% (one percent) increase in Immigrants from Bosnia and Herzegovina within a typical geography, there is an increase of 0.26% in percentage of households with 1 or more vehicles available.
It is essential to understand that the correlation between the percentage of Immigrants from Bosnia and Herzegovina and percentage of households with 1 or more vehicles available does not imply a direct cause-and-effect relationship. It remains uncertain whether the presence of Immigrants from Bosnia and Herzegovina influences an upward or downward trend in the level of percentage of households with 1 or more vehicles available within an area, or if Immigrants from Bosnia and Herzegovina simply ended up residing in those areas with higher or lower levels of percentage of households with 1 or more vehicles available due to other factors.
Demographics Similar to Immigrants from Bosnia and Herzegovina by 1 or more Vehicles in Household
In terms of 1 or more vehicles in household, the demographic groups most similar to Immigrants from Bosnia and Herzegovina are Immigrants from Micronesia (90.1%, a difference of 0.010%), Tlingit-Haida (90.1%, a difference of 0.020%), Immigrants from Nicaragua (90.1%, a difference of 0.030%), New Zealander (90.1%, a difference of 0.030%), and Immigrants from Uganda (90.1%, a difference of 0.030%).
| Demographics | Rating | Rank | 1 or more Vehicles in Household |
| Immigrants from Zimbabwe | 81.5 /100 | #144 | Excellent 90.2% |
| Sioux | 81.3 /100 | #145 | Excellent 90.2% |
| Bahamians | 80.5 /100 | #146 | Excellent 90.2% |
| Chileans | 79.8 /100 | #147 | Good 90.2% |
| Immigrants from Eastern Africa | 78.2 /100 | #148 | Good 90.1% |
| Immigrants from Nicaragua | 76.7 /100 | #149 | Good 90.1% |
| Immigrants from Micronesia | 75.9 /100 | #150 | Good 90.1% |
| Immigrants from Bosnia and Herzegovina | 75.4 /100 | #151 | Good 90.1% |
| Tlingit-Haida | 74.3 /100 | #152 | Good 90.1% |
| New Zealanders | 73.8 /100 | #153 | Good 90.1% |
| Immigrants from Uganda | 73.8 /100 | #154 | Good 90.1% |
| Immigrants | 73.6 /100 | #155 | Good 90.1% |
| Australians | 72.4 /100 | #156 | Good 90.0% |
| Immigrants from Congo | 71.2 /100 | #157 | Good 90.0% |
| Brazilians | 71.0 /100 | #158 | Good 90.0% |
Immigrants from Bosnia and Herzegovina 1 or more Vehicles in Household Correlation Summary
| Measurement | Immigrants from Bosnia and Herzegovina Data | 1 or more Vehicles in Household Data |
| Minimum | 0.041% | 79.7% |
| Maximum | 29.4% | 100.0% |
| Range | 29.4% | 20.3% |
| Mean | 4.6% | 92.5% |
| Median | 3.1% | 92.9% |
| Interquartile 25% (IQ1) | 1.5% | 91.6% |
| Interquartile 75% (IQ3) | 5.4% | 95.9% |
| Interquartile Range (IQR) | 3.9% | 4.3% |
| Standard Deviation (Sample) | 5.7% | 4.9% |
| Standard Deviation (Population) | 5.6% | 4.9% |
Correlation Details
| Immigrants from Bosnia and Herzegovina Percentile | Sample Size | 1 or more Vehicles in Household |
[ 0.0% - 0.5% ] 0.041% | 124,008,596 | 87.2% |
[ 0.0% - 0.5% ] 0.20% | 17,597,799 | 89.3% |
[ 0.0% - 0.5% ] 0.36% | 7,607,813 | 92.2% |
[ 0.5% - 1.0% ] 0.51% | 2,122,855 | 92.2% |
[ 0.5% - 1.0% ] 0.66% | 1,196,775 | 91.7% |
[ 0.5% - 1.0% ] 0.80% | 1,320,654 | 90.2% |
[ 0.5% - 1.0% ] 0.95% | 572,001 | 93.0% |
[ 1.0% - 1.5% ] 1.10% | 369,725 | 91.5% |
[ 1.0% - 1.5% ] 1.26% | 520,714 | 92.2% |
[ 1.0% - 1.5% ] 1.37% | 102,204 | 93.9% |
[ 1.5% - 2.0% ] 1.54% | 175,181 | 92.1% |
[ 1.5% - 2.0% ] 1.66% | 359,718 | 93.7% |
[ 1.5% - 2.0% ] 1.86% | 106,566 | 92.1% |
[ 1.5% - 2.0% ] 1.98% | 105,445 | 93.5% |
[ 2.0% - 2.5% ] 2.14% | 113,789 | 91.9% |
[ 2.0% - 2.5% ] 2.34% | 72,733 | 96.4% |
[ 2.0% - 2.5% ] 2.43% | 47,303 | 95.7% |
[ 2.5% - 3.0% ] 2.70% | 816 | 95.9% |
[ 2.5% - 3.0% ] 2.88% | 22,992 | 96.3% |
[ 3.0% - 3.5% ] 3.01% | 532 | 97.8% |
[ 3.0% - 3.5% ] 3.16% | 12,587 | 92.1% |
[ 3.0% - 3.5% ] 3.26% | 11,619 | 95.3% |
[ 3.0% - 3.5% ] 3.38% | 50,347 | 95.8% |
[ 3.5% - 4.0% ] 3.62% | 48,317 | 85.3% |
[ 3.5% - 4.0% ] 3.70% | 7,051 | 93.4% |
[ 3.5% - 4.0% ] 3.89% | 24,014 | 88.6% |
[ 4.0% - 4.5% ] 4.28% | 19,922 | 96.1% |
[ 4.0% - 4.5% ] 4.45% | 69,823 | 80.4% |
[ 4.5% - 5.0% ] 4.68% | 2,220 | 79.7% |
[ 5.0% - 5.5% ] 5.09% | 5,345 | 85.1% |
[ 5.5% - 6.0% ] 5.71% | 8,759 | 94.0% |
[ 6.0% - 6.5% ] 6.23% | 45,300 | 93.9% |
[ 6.0% - 6.5% ] 6.38% | 47 | 100.0% |
[ 6.5% - 7.0% ] 6.62% | 40,152 | 80.7% |
[ 6.5% - 7.0% ] 6.90% | 32,750 | 92.7% |
[ 8.0% - 8.5% ] 8.09% | 136 | 98.1% |
[ 10.5% - 11.0% ] 10.65% | 695 | 98.4% |
[ 15.0% - 15.5% ] 15.36% | 1,875 | 92.5% |
[ 20.5% - 21.0% ] 20.59% | 102 | 98.2% |
[ 29.0% - 29.5% ] 29.41% | 238 | 100.0% |