Subsaharan African Births to Unmarried Women
COMPARE
Subsaharan African
Select to Compare
Births to Unmarried Women
Subsaharan African Births to Unmarried Women
36.7%
BIRTHS TO UNMARRIED WOMEN
0.1/ 100
METRIC RATING
264th/ 347
METRIC RANK
Subsaharan African Births to Unmarried Women Correlation Chart
The statistical analysis conducted on geographies consisting of 468,897,335 people shows a substantial positive correlation between the proportion of Sub-Saharan Africans and percentage of births to unmarried women in the United States with a correlation coefficient (R) of 0.569 and weighted average of 36.7%. On average, for every 1% (one percent) increase in Sub-Saharan Africans within a typical geography, there is an increase of 0.85% in percentage of births to unmarried women.
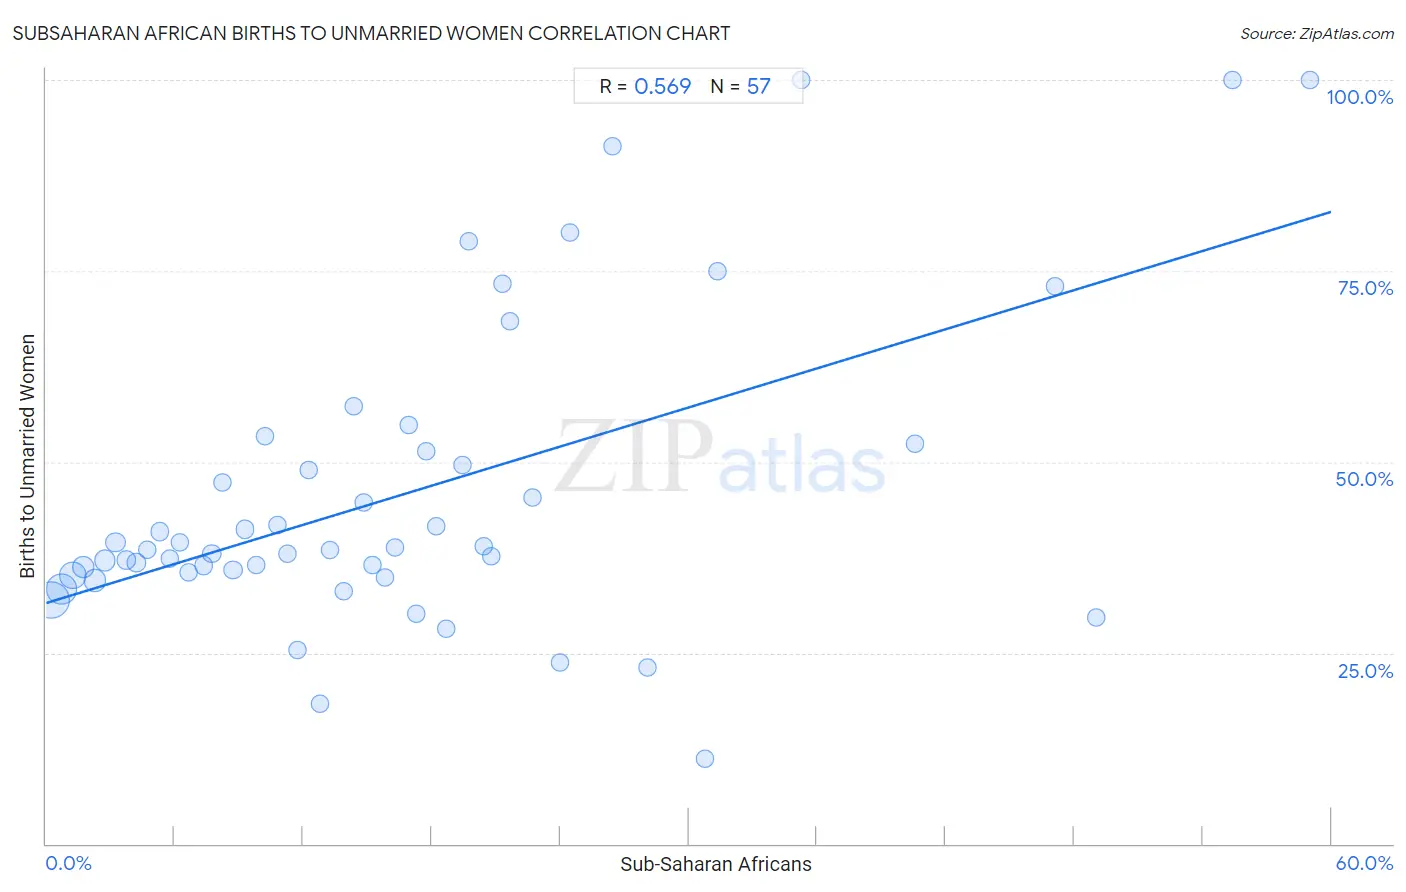
It is essential to understand that the correlation between the percentage of Sub-Saharan Africans and percentage of births to unmarried women does not imply a direct cause-and-effect relationship. It remains uncertain whether the presence of Sub-Saharan Africans influences an upward or downward trend in the level of percentage of births to unmarried women within an area, or if Sub-Saharan Africans simply ended up residing in those areas with higher or lower levels of percentage of births to unmarried women due to other factors.
Demographics Similar to Sub-Saharan Africans by Births to Unmarried Women
In terms of births to unmarried women, the demographic groups most similar to Sub-Saharan Africans are Cherokee (36.7%, a difference of 0.050%), Immigrants from Senegal (36.7%, a difference of 0.10%), Nicaraguan (36.6%, a difference of 0.12%), French American Indian (36.6%, a difference of 0.14%), and Central American (36.7%, a difference of 0.17%).
| Demographics | Rating | Rank | Births to Unmarried Women |
| Immigrants from Grenada | 0.2 /100 | #257 | Tragic 36.3% |
| Americans | 0.2 /100 | #258 | Tragic 36.4% |
| Immigrants from El Salvador | 0.2 /100 | #259 | Tragic 36.4% |
| Ottawa | 0.2 /100 | #260 | Tragic 36.5% |
| Trinidadians and Tobagonians | 0.2 /100 | #261 | Tragic 36.5% |
| French American Indians | 0.1 /100 | #262 | Tragic 36.6% |
| Nicaraguans | 0.1 /100 | #263 | Tragic 36.6% |
| Sub-Saharan Africans | 0.1 /100 | #264 | Tragic 36.7% |
| Cherokee | 0.1 /100 | #265 | Tragic 36.7% |
| Immigrants from Senegal | 0.1 /100 | #266 | Tragic 36.7% |
| Central Americans | 0.1 /100 | #267 | Tragic 36.7% |
| Comanche | 0.1 /100 | #268 | Tragic 36.7% |
| Senegalese | 0.1 /100 | #269 | Tragic 36.8% |
| Immigrants from Congo | 0.1 /100 | #270 | Tragic 36.8% |
| Immigrants from Barbados | 0.1 /100 | #271 | Tragic 36.8% |
Subsaharan African Births to Unmarried Women Correlation Summary
| Measurement | Subsaharan African Data | Births to Unmarried Women Data |
| Minimum | 0.24% | 11.1% |
| Maximum | 59.0% | 100.0% |
| Range | 58.8% | 88.9% |
| Mean | 16.8% | 45.9% |
| Median | 14.4% | 38.5% |
| Interquartile 25% (IQ1) | 7.0% | 35.3% |
| Interquartile 75% (IQ3) | 21.5% | 51.9% |
| Interquartile Range (IQR) | 14.5% | 16.5% |
| Standard Deviation (Sample) | 13.5% | 20.2% |
| Standard Deviation (Population) | 13.4% | 20.0% |
Correlation Details
| Subsaharan African Percentile | Sample Size | Births to Unmarried Women |
[ 0.0% - 0.5% ] 0.24% | 154,175,209 | 31.9% |
[ 0.5% - 1.0% ] 0.72% | 97,865,898 | 33.3% |
[ 1.0% - 1.5% ] 1.24% | 66,746,095 | 35.1% |
[ 1.5% - 2.0% ] 1.73% | 38,356,014 | 36.2% |
[ 2.0% - 2.5% ] 2.25% | 33,031,654 | 34.5% |
[ 2.5% - 3.0% ] 2.73% | 22,683,429 | 37.1% |
[ 3.0% - 3.5% ] 3.23% | 12,566,127 | 39.4% |
[ 3.5% - 4.0% ] 3.75% | 9,008,171 | 37.2% |
[ 4.0% - 4.5% ] 4.22% | 8,563,551 | 36.8% |
[ 4.5% - 5.0% ] 4.71% | 3,802,198 | 38.5% |
[ 5.0% - 5.5% ] 5.29% | 3,562,289 | 40.9% |
[ 5.5% - 6.0% ] 5.77% | 3,097,883 | 37.3% |
[ 6.0% - 6.5% ] 6.26% | 2,110,942 | 39.5% |
[ 6.5% - 7.0% ] 6.65% | 2,261,085 | 35.5% |
[ 7.0% - 7.5% ] 7.34% | 1,434,957 | 36.4% |
[ 7.5% - 8.0% ] 7.73% | 1,466,680 | 38.0% |
[ 8.0% - 8.5% ] 8.23% | 956,878 | 47.4% |
[ 8.5% - 9.0% ] 8.72% | 971,124 | 35.8% |
[ 9.0% - 9.5% ] 9.27% | 848,399 | 41.2% |
[ 9.5% - 10.0% ] 9.79% | 361,657 | 36.5% |
[ 10.0% - 10.5% ] 10.22% | 721,223 | 53.4% |
[ 10.5% - 11.0% ] 10.79% | 483,166 | 41.7% |
[ 11.0% - 11.5% ] 11.27% | 619,884 | 38.0% |
[ 11.5% - 12.0% ] 11.74% | 261,458 | 25.3% |
[ 12.0% - 12.5% ] 12.26% | 69,204 | 49.0% |
[ 12.5% - 13.0% ] 12.77% | 177,673 | 18.4% |
[ 13.0% - 13.5% ] 13.23% | 435,504 | 38.4% |
[ 13.5% - 14.0% ] 13.91% | 345,667 | 33.0% |
[ 14.0% - 14.5% ] 14.38% | 82,870 | 57.2% |
[ 14.5% - 15.0% ] 14.81% | 120,210 | 44.6% |
[ 15.0% - 15.5% ] 15.22% | 231,038 | 36.5% |
[ 15.5% - 16.0% ] 15.84% | 187,125 | 34.8% |
[ 16.0% - 16.5% ] 16.27% | 180,093 | 38.8% |
[ 16.5% - 17.0% ] 16.92% | 27,960 | 54.8% |
[ 17.0% - 17.5% ] 17.26% | 143,733 | 30.2% |
[ 17.5% - 18.0% ] 17.72% | 61,760 | 51.3% |
[ 18.0% - 18.5% ] 18.20% | 220,571 | 41.6% |
[ 18.5% - 19.0% ] 18.66% | 97,301 | 28.1% |
[ 19.0% - 19.5% ] 19.43% | 242,816 | 49.7% |
[ 19.5% - 20.0% ] 19.74% | 19,112 | 78.9% |
[ 20.0% - 20.5% ] 20.42% | 36,013 | 38.9% |
[ 20.5% - 21.0% ] 20.76% | 25,987 | 37.6% |
[ 21.0% - 21.5% ] 21.32% | 25,224 | 73.3% |
[ 21.5% - 22.0% ] 21.63% | 51,274 | 68.4% |
[ 22.5% - 23.0% ] 22.71% | 50,564 | 45.3% |
[ 23.5% - 24.0% ] 23.99% | 14,553 | 23.8% |
[ 24.0% - 24.5% ] 24.44% | 24,795 | 80.0% |
[ 26.0% - 26.5% ] 26.43% | 1,082 | 91.4% |
[ 28.0% - 28.5% ] 28.05% | 29,533 | 23.0% |
[ 30.5% - 31.0% ] 30.74% | 15,489 | 11.1% |
[ 31.0% - 31.5% ] 31.35% | 2,485 | 75.0% |
[ 35.0% - 35.5% ] 35.23% | 1,286 | 100.0% |
[ 40.5% - 41.0% ] 40.56% | 9,613 | 52.4% |
[ 47.0% - 47.5% ] 47.10% | 1,157 | 73.0% |
[ 49.0% - 49.5% ] 49.01% | 8,892 | 29.7% |
[ 55.0% - 55.5% ] 55.41% | 231 | 100.0% |
[ 59.0% - 59.5% ] 59.02% | 549 | 100.0% |