Zip Codes with the Highest Percentage of Self-Employed / Incorporated in Wyoming
RELATED REPORTS & OPTIONS
Self-Employed / Incorporated
Wyoming
Compare Zip Codes
Map of Zip Codes with the Highest Percentage of Self-Employed / Incorporated in Wyoming
0.0%
100.0%
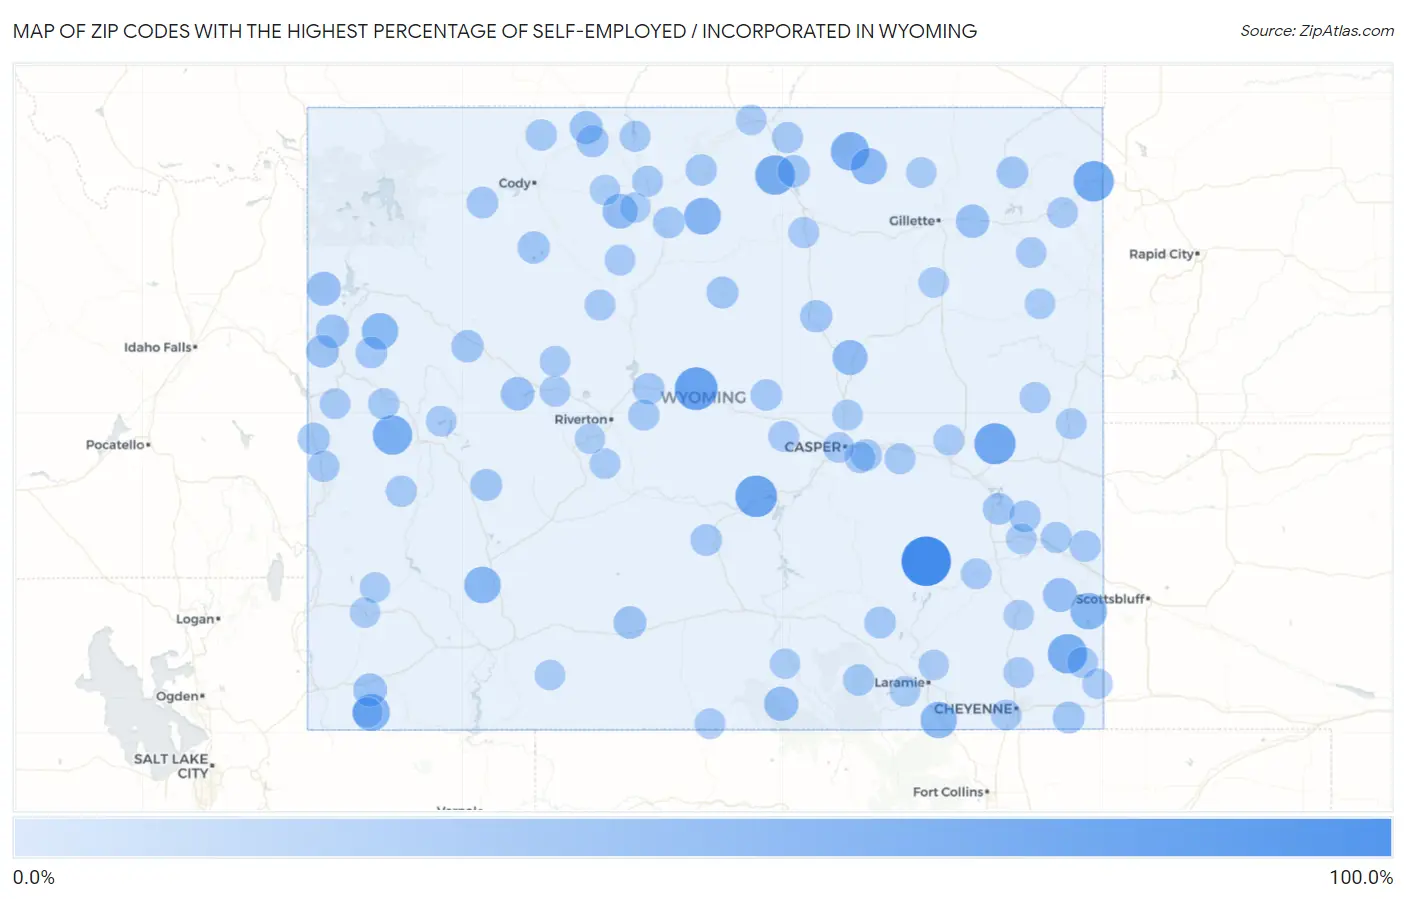
Zip Codes with the Highest Percentage of Self-Employed / Incorporated in Wyoming
| Zip Code | % Self-Employed / Incorporated | vs State | vs National | |
| 1. | 82058 | 100.0% | 4.9% (+95.1)#1 | 3.8% (+96.2)#23 |
| 2. | 82642 | 65.0% | 4.9% (+60.1)#2 | 3.8% (+61.2)#46 |
| 3. | 82620 | 59.5% | 4.9% (+54.6)#3 | 3.8% (+55.6)#57 |
| 4. | 82229 | 56.7% | 4.9% (+51.8)#4 | 3.8% (+52.8)#63 |
| 5. | 82712 | 52.7% | 4.9% (+47.8)#5 | 3.8% (+48.9)#74 |
| 6. | 82842 | 49.2% | 4.9% (+44.3)#6 | 3.8% (+45.4)#89 |
| 7. | 82081 | 47.8% | 4.9% (+42.9)#7 | 3.8% (+43.9)#96 |
| 8. | 83115 | 47.3% | 4.9% (+42.4)#8 | 3.8% (+43.5)#99 |
| 9. | 82837 | 42.1% | 4.9% (+37.2)#9 | 3.8% (+38.3)#119 |
| 10. | 82944 | 36.0% | 4.9% (+31.1)#10 | 3.8% (+32.2)#155 |
| 11. | 82428 | 34.8% | 4.9% (+29.9)#11 | 3.8% (+31.0)#165 |
| 12. | 82932 | 33.5% | 4.9% (+28.6)#12 | 3.8% (+29.7)#174 |
| 13. | 82217 | 33.3% | 4.9% (+28.4)#13 | 3.8% (+29.5)#177 |
| 14. | 82084 | 32.4% | 4.9% (+27.5)#14 | 3.8% (+28.5)#188 |
| 15. | 83011 | 32.3% | 4.9% (+27.4)#15 | 3.8% (+28.5)#190 |
| 16. | 82831 | 30.5% | 4.9% (+25.6)#16 | 3.8% (+26.7)#213 |
| 17. | 82643 | 25.7% | 4.9% (+20.8)#17 | 3.8% (+21.9)#296 |
| 18. | 82434 | 24.3% | 4.9% (+19.4)#18 | 3.8% (+20.5)#330 |
| 19. | 82325 | 21.9% | 4.9% (+17.0)#19 | 3.8% (+18.1)#410 |
| 20. | 83414 | 20.9% | 4.9% (+16.0)#20 | 3.8% (+17.1)#454 |
| 21. | 82244 | 20.6% | 4.9% (+15.7)#21 | 3.8% (+16.8)#476 |
| 22. | 82512 | 17.8% | 4.9% (+12.9)#22 | 3.8% (+14.0)#641 |
| 23. | 82727 | 17.4% | 4.9% (+12.5)#23 | 3.8% (+13.6)#668 |
| 24. | 82933 | 17.0% | 4.9% (+12.1)#24 | 3.8% (+13.2)#702 |
| 25. | 83025 | 16.4% | 4.9% (+11.5)#25 | 3.8% (+12.6)#770 |
| 26. | 82421 | 15.3% | 4.9% (+10.4)#26 | 3.8% (+11.4)#913 |
| 27. | 82336 | 14.2% | 4.9% (+9.31)#27 | 3.8% (+10.4)#1,095 |
| 28. | 83014 | 13.8% | 4.9% (+8.89)#28 | 3.8% (+9.96)#1,185 |
| 29. | 82832 | 12.4% | 4.9% (+7.48)#29 | 3.8% (+8.55)#1,481 |
| 30. | 82433 | 12.0% | 4.9% (+7.14)#30 | 3.8% (+8.21)#1,557 |
| 31. | 82639 | 11.9% | 4.9% (+7.02)#31 | 3.8% (+8.09)#1,584 |
| 32. | 82513 | 11.8% | 4.9% (+6.87)#32 | 3.8% (+7.95)#1,620 |
| 33. | 83127 | 11.5% | 4.9% (+6.60)#33 | 3.8% (+7.68)#1,722 |
| 34. | 82412 | 11.3% | 4.9% (+6.45)#34 | 3.8% (+7.53)#1,762 |
| 35. | 82442 | 10.2% | 4.9% (+5.28)#35 | 3.8% (+6.35)#2,232 |
| 36. | 82054 | 10.1% | 4.9% (+5.24)#36 | 3.8% (+6.31)#2,255 |
| 37. | 82923 | 9.8% | 4.9% (+4.88)#37 | 3.8% (+5.95)#2,431 |
| 38. | 82213 | 9.4% | 4.9% (+4.55)#38 | 3.8% (+5.63)#2,619 |
| 39. | 82721 | 9.4% | 4.9% (+4.52)#39 | 3.8% (+5.59)#2,634 |
| 40. | 82322 | 9.1% | 4.9% (+4.20)#40 | 3.8% (+5.27)#2,828 |
| 41. | 82083 | 8.9% | 4.9% (+4.03)#41 | 3.8% (+5.10)#2,930 |
| 42. | 82215 | 8.7% | 4.9% (+3.81)#42 | 3.8% (+4.88)#3,085 |
| 43. | 83001 | 8.6% | 4.9% (+3.72)#43 | 3.8% (+4.79)#3,144 |
| 44. | 82414 | 8.3% | 4.9% (+3.42)#44 | 3.8% (+4.49)#3,388 |
| 45. | 82432 | 8.3% | 4.9% (+3.39)#45 | 3.8% (+4.47)#3,414 |
| 46. | 82649 | 8.2% | 4.9% (+3.27)#46 | 3.8% (+4.34)#3,512 |
| 47. | 82636 | 8.1% | 4.9% (+3.23)#47 | 3.8% (+4.30)#3,554 |
| 48. | 82240 | 7.9% | 4.9% (+2.98)#48 | 3.8% (+4.05)#3,789 |
| 49. | 82055 | 7.9% | 4.9% (+2.98)#49 | 3.8% (+4.05)#3,794 |
| 50. | 83110 | 7.8% | 4.9% (+2.90)#50 | 3.8% (+3.97)#3,874 |
| 51. | 82648 | 7.5% | 4.9% (+2.61)#51 | 3.8% (+3.68)#4,172 |
| 52. | 82441 | 7.4% | 4.9% (+2.49)#52 | 3.8% (+3.56)#4,305 |
| 53. | 82435 | 7.3% | 4.9% (+2.44)#53 | 3.8% (+3.51)#4,365 |
| 54. | 83113 | 7.1% | 4.9% (+2.23)#54 | 3.8% (+3.31)#4,610 |
| 55. | 82922 | 6.8% | 4.9% (+1.91)#55 | 3.8% (+2.98)#5,036 |
| 56. | 82801 | 6.6% | 4.9% (+1.70)#56 | 3.8% (+2.77)#5,368 |
| 57. | 82050 | 5.9% | 4.9% (+1.05)#57 | 3.8% (+2.12)#6,453 |
| 58. | 82609 | 5.9% | 4.9% (+1.05)#58 | 3.8% (+2.12)#6,459 |
| 59. | 82501 | 5.9% | 4.9% (+1.01)#59 | 3.8% (+2.09)#6,515 |
| 60. | 82637 | 5.8% | 4.9% (+0.900)#60 | 3.8% (+1.97)#6,725 |
| 61. | 82212 | 5.8% | 4.9% (+0.872)#61 | 3.8% (+1.94)#6,775 |
| 62. | 82426 | 5.7% | 4.9% (+0.809)#62 | 3.8% (+1.88)#6,899 |
| 63. | 82431 | 5.6% | 4.9% (+0.691)#63 | 3.8% (+1.76)#7,162 |
| 64. | 82443 | 5.4% | 4.9% (+0.471)#64 | 3.8% (+1.54)#7,676 |
| 65. | 82834 | 5.4% | 4.9% (+0.461)#65 | 3.8% (+1.53)#7,700 |
| 66. | 82729 | 5.1% | 4.9% (+0.238)#66 | 3.8% (+1.31)#8,259 |
| 67. | 82633 | 5.1% | 4.9% (+0.175)#67 | 3.8% (+1.25)#8,410 |
| 68. | 82516 | 5.0% | 4.9% (+0.152)#68 | 3.8% (+1.22)#8,484 |
| 69. | 82222 | 5.0% | 4.9% (+0.069)#69 | 3.8% (+1.14)#8,711 |
| 70. | 82401 | 4.9% | 4.9% (-0.017)#70 | 3.8% (+1.06)#8,961 |
| 71. | 82644 | 4.6% | 4.9% (-0.257)#71 | 3.8% (+0.816)#9,678 |
| 72. | 83128 | 4.6% | 4.9% (-0.258)#72 | 3.8% (+0.814)#9,684 |
| 73. | 82604 | 4.6% | 4.9% (-0.317)#73 | 3.8% (+0.756)#9,853 |
| 74. | 82520 | 4.4% | 4.9% (-0.493)#74 | 3.8% (+0.580)#10,450 |
| 75. | 82225 | 4.2% | 4.9% (-0.693)#75 | 3.8% (+0.380)#11,180 |
| 76. | 82201 | 4.2% | 4.9% (-0.723)#76 | 3.8% (+0.349)#11,272 |
| 77. | 82601 | 4.1% | 4.9% (-0.808)#77 | 3.8% (+0.264)#11,596 |
| 78. | 82009 | 4.0% | 4.9% (-0.882)#78 | 3.8% (+0.190)#11,899 |
| 79. | 82523 | 4.0% | 4.9% (-0.900)#79 | 3.8% (+0.173)#11,957 |
| 80. | 82941 | 4.0% | 4.9% (-0.902)#80 | 3.8% (+0.170)#11,963 |
| 81. | 82323 | 4.0% | 4.9% (-0.921)#81 | 3.8% (+0.151)#12,042 |
| 82. | 82730 | 3.8% | 4.9% (-1.11)#82 | 3.8% (-0.033)#12,820 |
| 83. | 82001 | 3.6% | 4.9% (-1.29)#83 | 3.8% (-0.219)#13,616 |
| 84. | 82214 | 3.6% | 4.9% (-1.31)#84 | 3.8% (-0.238)#13,683 |
| 85. | 82716 | 3.4% | 4.9% (-1.48)#85 | 3.8% (-0.406)#14,438 |
| 86. | 82839 | 3.4% | 4.9% (-1.48)#86 | 3.8% (-0.406)#14,441 |
| 87. | 82411 | 3.3% | 4.9% (-1.61)#87 | 3.8% (-0.539)#15,035 |
| 88. | 82930 | 3.2% | 4.9% (-1.69)#88 | 3.8% (-0.621)#15,421 |
| 89. | 82718 | 3.0% | 4.9% (-1.90)#89 | 3.8% (-0.830)#16,465 |
| 90. | 82901 | 3.0% | 4.9% (-1.93)#90 | 3.8% (-0.856)#16,586 |
| 91. | 82410 | 2.9% | 4.9% (-1.97)#91 | 3.8% (-0.893)#16,781 |
| 92. | 82701 | 2.9% | 4.9% (-1.97)#92 | 3.8% (-0.896)#16,798 |
| 93. | 82072 | 2.9% | 4.9% (-1.97)#93 | 3.8% (-0.900)#16,821 |
| 94. | 82070 | 2.9% | 4.9% (-1.99)#94 | 3.8% (-0.917)#16,900 |
| 95. | 82082 | 2.9% | 4.9% (-2.00)#95 | 3.8% (-0.925)#16,940 |
| 96. | 83101 | 2.7% | 4.9% (-2.16)#96 | 3.8% (-1.08)#17,695 |
| 97. | 82331 | 2.6% | 4.9% (-2.28)#97 | 3.8% (-1.21)#18,381 |
| 98. | 82515 | 2.6% | 4.9% (-2.29)#98 | 3.8% (-1.22)#18,439 |
| 99. | 83116 | 2.5% | 4.9% (-2.34)#99 | 3.8% (-1.27)#18,662 |
| 100. | 82210 | 2.5% | 4.9% (-2.42)#100 | 3.8% (-1.35)#19,048 |
1
2Common Questions
What are the Top 10 Zip Codes with the Highest Percentage of Self-Employed / Incorporated in Wyoming?
Top 10 Zip Codes with the Highest Percentage of Self-Employed / Incorporated in Wyoming are:
What zip code has the Highest Percentage of Self-Employed / Incorporated in Wyoming?
82058 has the Highest Percentage of Self-Employed / Incorporated in Wyoming with 100.0%.
What is the Percentage of Self-Employed / Incorporated in the State of Wyoming?
Percentage of Self-Employed / Incorporated in Wyoming is 4.9%.
What is the Percentage of Self-Employed / Incorporated in the United States?
Percentage of Self-Employed / Incorporated in the United States is 3.8%.