Zip Codes with the Highest Percentage of Households with Income Above $100,000 in Wyoming
RELATED REPORTS & OPTIONS
Household Income | $100k+
Wyoming
Compare Zip Codes
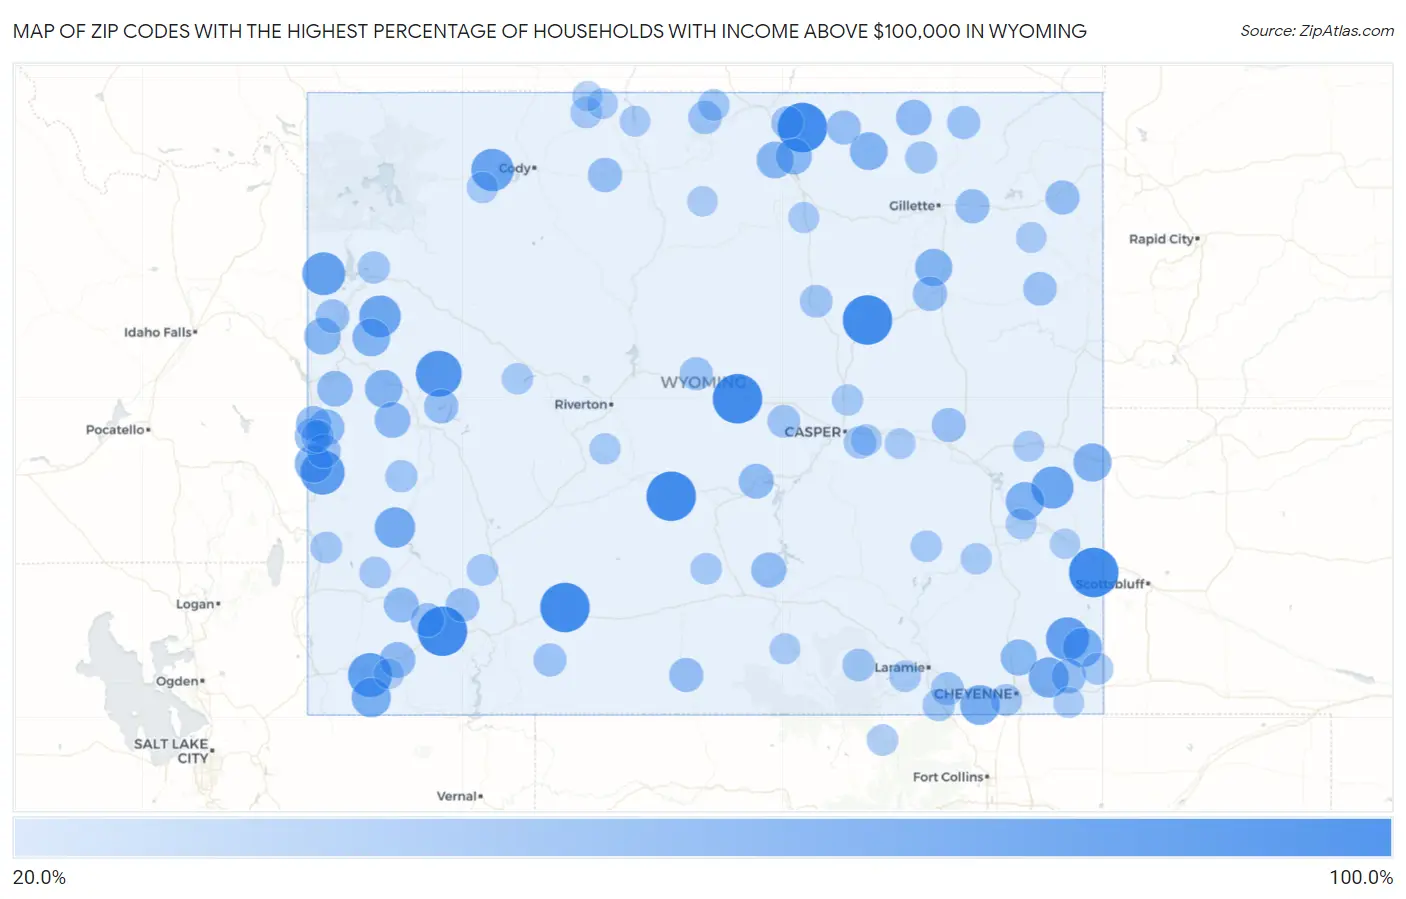
Map of Zip Codes with the Highest Percentage of Households with Income Above $100,000 in Wyoming
20.0%
100.0%
Zip Codes with the Highest Percentage of Households with Income Above $100,000 in Wyoming
| Zip Code | Households with Income > $100k | vs State | vs National | |
| 1. | 82638 | 100.0% | 34.6%(+65.4)#2 | 37.3%(+62.7)#50 |
| 2. | 82640 | 100.0% | 34.6%(+65.4)#3 | 37.3%(+62.7)#51 |
| 3. | 82845 | 100.0% | 34.6%(+65.4)#4 | 37.3%(+62.7)#60 |
| 4. | 82942 | 100.0% | 34.6%(+65.4)#5 | 37.3%(+62.7)#66 |
| 5. | 82310 | 100.0% | 34.6%(+65.4)#6 | 37.3%(+62.7)#100 |
| 6. | 82929 | 100.0% | 34.6%(+65.4)#7 | 37.3%(+62.7)#121 |
| 7. | 82218 | 100.0% | 34.6%(+65.4)#8 | 37.3%(+62.7)#134 |
| 8. | 82925 | 86.3% | 34.6%(+51.7)#9 | 37.3%(+49.0)#212 |
| 9. | 83126 | 80.1% | 34.6%(+45.5)#10 | 37.3%(+42.8)#339 |
| 10. | 82933 | 78.2% | 34.6%(+43.6)#11 | 37.3%(+40.9)#416 |
| 11. | 82081 | 75.0% | 34.6%(+40.4)#12 | 37.3%(+37.7)#576 |
| 12. | 83414 | 74.7% | 34.6%(+40.1)#13 | 37.3%(+37.4)#592 |
| 13. | 82450 | 73.0% | 34.6%(+38.4)#14 | 37.3%(+35.7)#707 |
| 14. | 82219 | 71.4% | 34.6%(+36.8)#15 | 37.3%(+34.1)#837 |
| 15. | 83011 | 70.0% | 34.6%(+35.4)#16 | 37.3%(+32.7)#971 |
| 16. | 83123 | 65.3% | 34.6%(+30.7)#17 | 37.3%(+28.0)#1,505 |
| 17. | 82060 | 64.1% | 34.6%(+29.5)#18 | 37.3%(+26.8)#1,672 |
| 18. | 82059 | 62.7% | 34.6%(+28.1)#19 | 37.3%(+25.4)#1,909 |
| 19. | 82050 | 61.0% | 34.6%(+26.4)#20 | 37.3%(+23.7)#2,191 |
| 20. | 82944 | 60.8% | 34.6%(+26.2)#21 | 37.3%(+23.5)#2,221 |
| 21. | 82215 | 57.5% | 34.6%(+22.9)#22 | 37.3%(+20.2)#2,882 |
| 22. | 82242 | 56.8% | 34.6%(+22.2)#23 | 37.3%(+19.5)#3,040 |
| 23. | 83119 | 56.3% | 34.6%(+21.7)#24 | 37.3%(+19.0)#3,142 |
| 24. | 83001 | 55.4% | 34.6%(+20.8)#25 | 37.3%(+18.1)#3,354 |
| 25. | 82831 | 54.8% | 34.6%(+20.2)#26 | 37.3%(+17.5)#3,519 |
| 26. | 82922 | 54.5% | 34.6%(+19.9)#27 | 37.3%(+17.2)#3,599 |
| 27. | 82718 | 53.2% | 34.6%(+18.6)#28 | 37.3%(+15.9)#3,922 |
| 28. | 82842 | 51.8% | 34.6%(+17.2)#29 | 37.3%(+14.5)#4,316 |
| 29. | 83014 | 51.0% | 34.6%(+16.4)#30 | 37.3%(+13.7)#4,551 |
| 30. | 82832 | 50.0% | 34.6%(+15.4)#31 | 37.3%(+12.7)#4,832 |
| 31. | 83112 | 49.5% | 34.6%(+14.9)#32 | 37.3%(+12.2)#5,038 |
| 32. | 82009 | 49.2% | 34.6%(+14.6)#33 | 37.3%(+11.9)#5,104 |
| 33. | 82937 | 47.8% | 34.6%(+13.2)#34 | 37.3%(+10.5)#5,576 |
| 34. | 83128 | 47.6% | 34.6%(+13.0)#35 | 37.3%(+10.3)#5,651 |
| 35. | 83115 | 47.6% | 34.6%(+13.0)#36 | 37.3%(+10.3)#5,658 |
| 36. | 83111 | 46.6% | 34.6%(+12.0)#37 | 37.3%(+9.30)#6,000 |
| 37. | 82725 | 46.3% | 34.6%(+11.7)#38 | 37.3%(+9.00)#6,115 |
| 38. | 83127 | 46.1% | 34.6%(+11.5)#39 | 37.3%(+8.80)#6,180 |
| 39. | 82334 | 45.2% | 34.6%(+10.6)#40 | 37.3%(+7.90)#6,563 |
| 40. | 83124 | 44.7% | 34.6%(+10.1)#41 | 37.3%(+7.40)#6,767 |
| 41. | 82620 | 44.5% | 34.6%(+9.90)#42 | 37.3%(+7.20)#6,834 |
| 42. | 82053 | 43.0% | 34.6%(+8.40)#43 | 37.3%(+5.70)#7,458 |
| 43. | 82732 | 42.6% | 34.6%(+8.00)#44 | 37.3%(+5.30)#7,645 |
| 44. | 82411 | 42.6% | 34.6%(+8.00)#45 | 37.3%(+5.30)#7,652 |
| 45. | 82727 | 42.1% | 34.6%(+7.50)#46 | 37.3%(+4.80)#7,870 |
| 46. | 82941 | 41.9% | 34.6%(+7.30)#47 | 37.3%(+4.60)#7,948 |
| 47. | 82729 | 41.8% | 34.6%(+7.20)#48 | 37.3%(+4.50)#8,005 |
| 48. | 82321 | 41.7% | 34.6%(+7.10)#49 | 37.3%(+4.40)#8,054 |
| 49. | 82835 | 41.3% | 34.6%(+6.70)#50 | 37.3%(+4.00)#8,270 |
| 50. | 82633 | 41.1% | 34.6%(+6.50)#51 | 37.3%(+3.80)#8,349 |
| 51. | 82935 | 40.5% | 34.6%(+5.90)#52 | 37.3%(+3.20)#8,666 |
| 52. | 82934 | 40.5% | 34.6%(+5.90)#53 | 37.3%(+3.20)#8,690 |
| 53. | 83110 | 40.3% | 34.6%(+5.70)#54 | 37.3%(+3.00)#8,763 |
| 54. | 83025 | 40.3% | 34.6%(+5.70)#55 | 37.3%(+3.00)#8,772 |
| 55. | 82701 | 39.7% | 34.6%(+5.10)#56 | 37.3%(+2.40)#9,079 |
| 56. | 82836 | 39.1% | 34.6%(+4.50)#57 | 37.3%(+1.80)#9,399 |
| 57. | 82642 | 38.3% | 34.6%(+3.70)#58 | 37.3%(+1.000)#9,856 |
| 58. | 82731 | 38.0% | 34.6%(+3.40)#59 | 37.3%(+0.700)#10,032 |
| 59. | 82901 | 37.6% | 34.6%(+3.00)#60 | 37.3%(+0.300)#10,199 |
| 60. | 82073 | 37.5% | 34.6%(+2.90)#61 | 37.3%(+0.200)#10,310 |
| 61. | 82639 | 36.3% | 34.6%(+1.70)#62 | 37.3%(-1.00)#11,011 |
| 62. | 82604 | 36.2% | 34.6%(+1.60)#63 | 37.3%(-1.10)#11,028 |
| 63. | 83122 | 35.9% | 34.6%(+1.30)#64 | 37.3%(-1.40)#11,232 |
| 64. | 82801 | 35.8% | 34.6%(+1.20)#65 | 37.3%(-1.50)#11,250 |
| 65. | 82055 | 35.7% | 34.6%(+1.10)#66 | 37.3%(-1.60)#11,363 |
| 66. | 82609 | 35.3% | 34.6%(+0.700)#67 | 37.3%(-2.00)#11,592 |
| 67. | 83113 | 35.0% | 34.6%(+0.400)#68 | 37.3%(-2.30)#11,788 |
| 68. | 83013 | 34.7% | 34.6%(+0.100)#69 | 37.3%(-2.60)#11,993 |
| 69. | 82084 | 34.7% | 34.6%(+0.100)#70 | 37.3%(-2.60)#12,003 |
| 70. | 82716 | 34.1% | 34.6%(-0.500)#71 | 37.3%(-3.20)#12,337 |
| 71. | 83114 | 33.0% | 34.6%(-1.60)#72 | 37.3%(-4.30)#13,158 |
| 72. | 82082 | 32.8% | 34.6%(-1.80)#73 | 37.3%(-4.50)#13,294 |
| 73. | 82838 | 32.7% | 34.6%(-1.90)#74 | 37.3%(-4.60)#13,371 |
| 74. | 82001 | 32.6% | 34.6%(-2.00)#75 | 37.3%(-4.70)#13,386 |
| 75. | 83101 | 32.4% | 34.6%(-2.20)#76 | 37.3%(-4.90)#13,558 |
| 76. | 82421 | 32.1% | 34.6%(-2.50)#77 | 37.3%(-5.20)#13,842 |
| 77. | 82301 | 32.0% | 34.6%(-2.60)#78 | 37.3%(-5.30)#13,875 |
| 78. | 82070 | 31.8% | 34.6%(-2.80)#79 | 37.3%(-5.50)#14,014 |
| 79. | 82932 | 31.8% | 34.6%(-2.80)#80 | 37.3%(-5.50)#14,065 |
| 80. | 82414 | 31.4% | 34.6%(-3.20)#81 | 37.3%(-5.90)#14,312 |
| 81. | 82063 | 31.3% | 34.6%(-3.30)#82 | 37.3%(-6.00)#14,445 |
| 82. | 82058 | 31.3% | 34.6%(-3.30)#83 | 37.3%(-6.00)#14,450 |
| 83. | 82201 | 31.1% | 34.6%(-3.50)#84 | 37.3%(-6.20)#14,573 |
| 84. | 82512 | 31.1% | 34.6%(-3.50)#85 | 37.3%(-6.20)#14,623 |
| 85. | 82601 | 30.9% | 34.6%(-3.70)#86 | 37.3%(-6.40)#14,718 |
| 86. | 82520 | 30.9% | 34.6%(-3.70)#87 | 37.3%(-6.40)#14,733 |
| 87. | 82636 | 30.9% | 34.6%(-3.70)#88 | 37.3%(-6.40)#14,744 |
| 88. | 82214 | 30.0% | 34.6%(-4.60)#89 | 37.3%(-7.30)#15,486 |
| 89. | 82834 | 29.8% | 34.6%(-4.80)#90 | 37.3%(-7.50)#15,601 |
| 90. | 82227 | 29.6% | 34.6%(-5.00)#91 | 37.3%(-7.70)#15,811 |
| 91. | 82054 | 29.5% | 34.6%(-5.10)#92 | 37.3%(-7.80)#15,881 |
| 92. | 82637 | 29.4% | 34.6%(-5.20)#93 | 37.3%(-7.90)#15,940 |
| 93. | 82431 | 29.2% | 34.6%(-5.40)#94 | 37.3%(-8.10)#16,091 |
| 94. | 82420 | 29.2% | 34.6%(-5.40)#95 | 37.3%(-8.10)#16,128 |
| 95. | 82331 | 29.1% | 34.6%(-5.50)#96 | 37.3%(-8.20)#16,186 |
| 96. | 82730 | 28.9% | 34.6%(-5.70)#97 | 37.3%(-8.40)#16,367 |
| 97. | 82423 | 28.2% | 34.6%(-6.40)#98 | 37.3%(-9.10)#17,013 |
| 98. | 82939 | 28.1% | 34.6%(-6.50)#99 | 37.3%(-9.20)#17,072 |
| 99. | 82428 | 27.9% | 34.6%(-6.70)#100 | 37.3%(-9.40)#17,291 |
| 100. | 82223 | 27.5% | 34.6%(-7.10)#101 | 37.3%(-9.80)#17,606 |
1
2Common Questions
What are the Top 10 Zip Codes with the Highest Percentage of Households with Income Above $100,000 in Wyoming?
Top 10 Zip Codes with the Highest Percentage of Households with Income Above $100,000 in Wyoming are:
What zip code has the Highest Percentage of Households with Income Above $100,000 in Wyoming?
82638 has the Highest Percentage of Households with Income Above $100,000 in Wyoming with 100.0%.
What is the Percentage of Households with Income Above $100,000 in the State of Wyoming?
Percentage of Households with Income Above $100,000 in Wyoming is 34.6%.
What is the Percentage of Households with Income Above $100,000 in the United States?
Percentage of Households with Income Above $100,000 in the United States is 37.3%.