Zip Codes with the Highest Percentage of Population Employed in Health Care & Social Assistance in Wyoming
RELATED REPORTS & OPTIONS
Health Care & Social Assistance
Wyoming
Compare Zip Codes
Map of Zip Codes with the Highest Percentage of Population Employed in Health Care & Social Assistance in Wyoming
0.0%
100.0%
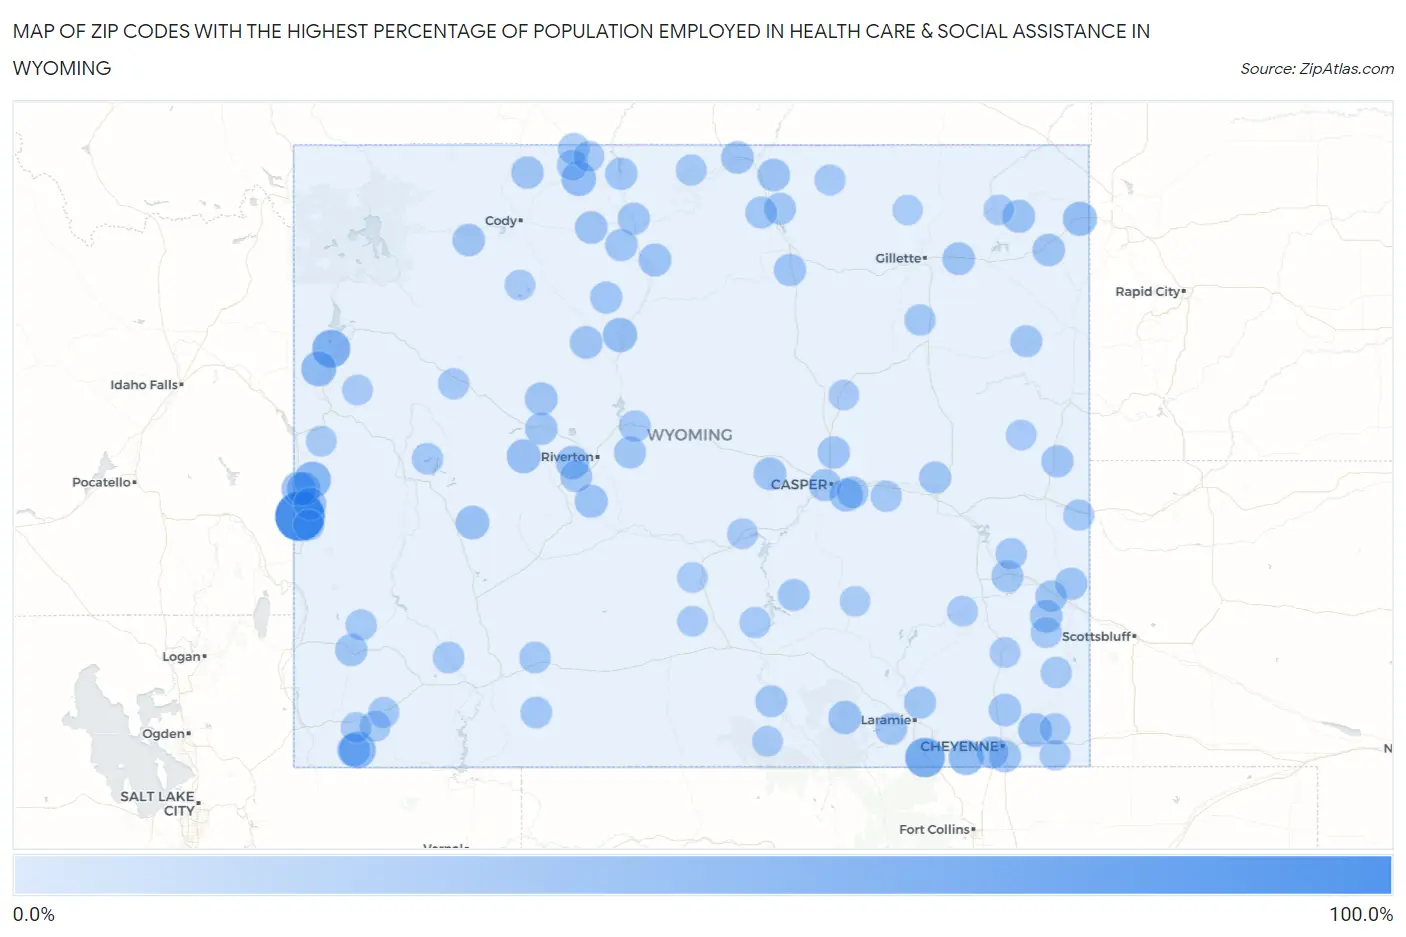
Zip Codes with the Highest Percentage of Population Employed in Health Care & Social Assistance in Wyoming
| Zip Code | % Employed | vs State | vs National | |
| 1. | 83119 | 100.0% | 13.1% (+86.9)#1 | 13.9% (+86.1)#8 |
| 2. | 82084 | 50.0% | 13.1% (+36.9)#2 | 13.9% (+36.1)#221 |
| 3. | 83012 | 42.5% | 13.1% (+29.4)#3 | 13.9% (+28.6)#349 |
| 4. | 83112 | 36.5% | 13.1% (+23.4)#4 | 13.9% (+22.6)#521 |
| 5. | 82944 | 36.0% | 13.1% (+22.9)#5 | 13.9% (+22.1)#541 |
| 6. | 83025 | 28.1% | 13.1% (+15.0)#6 | 13.9% (+14.2)#1,159 |
| 7. | 82059 | 28.0% | 13.1% (+14.9)#7 | 13.9% (+14.1)#1,183 |
| 8. | 82412 | 26.0% | 13.1% (+12.9)#8 | 13.9% (+12.1)#1,511 |
| 9. | 83111 | 25.6% | 13.1% (+12.5)#9 | 13.9% (+11.6)#1,598 |
| 10. | 82430 | 25.0% | 13.1% (+11.9)#10 | 13.9% (+11.1)#1,742 |
| 11. | 82712 | 23.6% | 13.1% (+10.5)#11 | 13.9% (+9.70)#2,097 |
| 12. | 83122 | 23.6% | 13.1% (+10.5)#12 | 13.9% (+9.63)#2,123 |
| 13. | 82514 | 23.1% | 13.1% (+9.96)#13 | 13.9% (+9.12)#2,330 |
| 14. | 82060 | 21.8% | 13.1% (+8.74)#14 | 13.9% (+7.90)#2,888 |
| 15. | 82923 | 21.3% | 13.1% (+8.17)#15 | 13.9% (+7.33)#3,189 |
| 16. | 82510 | 19.6% | 13.1% (+6.52)#16 | 13.9% (+5.68)#4,388 |
| 17. | 82055 | 19.4% | 13.1% (+6.29)#17 | 13.9% (+5.45)#4,616 |
| 18. | 82609 | 18.9% | 13.1% (+5.75)#18 | 13.9% (+4.91)#5,139 |
| 19. | 82520 | 18.6% | 13.1% (+5.48)#19 | 13.9% (+4.64)#5,452 |
| 20. | 82930 | 18.5% | 13.1% (+5.41)#20 | 13.9% (+4.57)#5,540 |
| 21. | 82714 | 18.4% | 13.1% (+5.32)#21 | 13.9% (+4.49)#5,659 |
| 22. | 82432 | 17.8% | 13.1% (+4.66)#22 | 13.9% (+3.82)#6,543 |
| 23. | 82523 | 17.6% | 13.1% (+4.51)#23 | 13.9% (+3.67)#6,772 |
| 24. | 82443 | 17.4% | 13.1% (+4.30)#24 | 13.9% (+3.46)#7,107 |
| 25. | 82604 | 17.0% | 13.1% (+3.91)#25 | 13.9% (+3.07)#7,702 |
| 26. | 83110 | 16.8% | 13.1% (+3.69)#26 | 13.9% (+2.85)#8,062 |
| 27. | 82411 | 16.7% | 13.1% (+3.62)#27 | 13.9% (+2.79)#8,156 |
| 28. | 82839 | 16.6% | 13.1% (+3.54)#28 | 13.9% (+2.71)#8,313 |
| 29. | 82727 | 16.6% | 13.1% (+3.46)#29 | 13.9% (+2.62)#8,463 |
| 30. | 82801 | 16.3% | 13.1% (+3.19)#30 | 13.9% (+2.35)#8,948 |
| 31. | 82243 | 16.2% | 13.1% (+3.09)#31 | 13.9% (+2.25)#9,142 |
| 32. | 82729 | 15.8% | 13.1% (+2.74)#32 | 13.9% (+1.90)#9,853 |
| 33. | 82414 | 15.8% | 13.1% (+2.70)#33 | 13.9% (+1.86)#9,924 |
| 34. | 82435 | 15.8% | 13.1% (+2.66)#34 | 13.9% (+1.82)#10,008 |
| 35. | 82009 | 15.7% | 13.1% (+2.59)#35 | 13.9% (+1.75)#10,140 |
| 36. | 82516 | 15.6% | 13.1% (+2.46)#36 | 13.9% (+1.62)#10,392 |
| 37. | 82431 | 15.4% | 13.1% (+2.30)#37 | 13.9% (+1.46)#10,749 |
| 38. | 82601 | 15.1% | 13.1% (+2.04)#38 | 13.9% (+1.20)#11,322 |
| 39. | 82240 | 14.9% | 13.1% (+1.84)#39 | 13.9% (+0.997)#11,815 |
| 40. | 82834 | 14.8% | 13.1% (+1.74)#40 | 13.9% (+0.898)#12,038 |
| 41. | 82401 | 14.7% | 13.1% (+1.56)#41 | 13.9% (+0.725)#12,452 |
| 42. | 82426 | 14.7% | 13.1% (+1.56)#42 | 13.9% (+0.723)#12,457 |
| 43. | 82225 | 14.6% | 13.1% (+1.50)#43 | 13.9% (+0.657)#12,610 |
| 44. | 83116 | 14.6% | 13.1% (+1.49)#44 | 13.9% (+0.648)#12,632 |
| 45. | 82410 | 14.5% | 13.1% (+1.37)#45 | 13.9% (+0.532)#12,927 |
| 46. | 82007 | 14.4% | 13.1% (+1.35)#46 | 13.9% (+0.513)#12,972 |
| 47. | 82001 | 14.4% | 13.1% (+1.29)#47 | 13.9% (+0.454)#13,115 |
| 48. | 82644 | 14.3% | 13.1% (+1.19)#48 | 13.9% (+0.350)#13,352 |
| 49. | 82501 | 13.7% | 13.1% (+0.609)#49 | 13.9% (-0.230)#14,779 |
| 50. | 82072 | 13.5% | 13.1% (+0.362)#50 | 13.9% (-0.477)#15,380 |
| 51. | 82214 | 13.5% | 13.1% (+0.361)#51 | 13.9% (-0.479)#15,385 |
| 52. | 82832 | 13.4% | 13.1% (+0.341)#52 | 13.9% (-0.499)#15,441 |
| 53. | 82636 | 13.3% | 13.1% (+0.201)#53 | 13.9% (-0.638)#15,801 |
| 54. | 82633 | 13.3% | 13.1% (+0.194)#54 | 13.9% (-0.645)#15,825 |
| 55. | 82515 | 13.1% | 13.1% (-0.016)#55 | 13.9% (-0.855)#16,387 |
| 56. | 82842 | 13.0% | 13.1% (-0.093)#56 | 13.9% (-0.933)#16,576 |
| 57. | 82331 | 12.9% | 13.1% (-0.204)#57 | 13.9% (-1.04)#16,848 |
| 58. | 82701 | 12.6% | 13.1% (-0.516)#58 | 13.9% (-1.35)#17,636 |
| 59. | 82327 | 12.4% | 13.1% (-0.674)#59 | 13.9% (-1.51)#18,041 |
| 60. | 82223 | 12.4% | 13.1% (-0.700)#60 | 13.9% (-1.54)#18,110 |
| 61. | 82070 | 12.1% | 13.1% (-0.980)#61 | 13.9% (-1.82)#18,768 |
| 62. | 82901 | 11.7% | 13.1% (-1.37)#62 | 13.9% (-2.21)#19,652 |
| 63. | 82935 | 11.7% | 13.1% (-1.42)#63 | 13.9% (-2.26)#19,779 |
| 64. | 82945 | 11.5% | 13.1% (-1.56)#64 | 13.9% (-2.40)#20,117 |
| 65. | 82423 | 11.5% | 13.1% (-1.56)#65 | 13.9% (-2.40)#20,119 |
| 66. | 82649 | 11.0% | 13.1% (-2.07)#66 | 13.9% (-2.91)#21,294 |
| 67. | 82941 | 10.6% | 13.1% (-2.50)#67 | 13.9% (-3.34)#22,252 |
| 68. | 82718 | 10.5% | 13.1% (-2.64)#68 | 13.9% (-3.48)#22,536 |
| 69. | 82215 | 10.4% | 13.1% (-2.66)#69 | 13.9% (-3.50)#22,579 |
| 70. | 82637 | 9.8% | 13.1% (-3.25)#70 | 13.9% (-4.09)#23,723 |
| 71. | 82221 | 9.8% | 13.1% (-3.33)#71 | 13.9% (-4.17)#23,887 |
| 72. | 83101 | 9.7% | 13.1% (-3.39)#72 | 13.9% (-4.23)#24,002 |
| 73. | 82513 | 9.4% | 13.1% (-3.65)#73 | 13.9% (-4.49)#24,470 |
| 74. | 82421 | 9.3% | 13.1% (-3.77)#74 | 13.9% (-4.61)#24,675 |
| 75. | 82244 | 9.3% | 13.1% (-3.79)#75 | 13.9% (-4.63)#24,696 |
| 76. | 83126 | 9.3% | 13.1% (-3.82)#76 | 13.9% (-4.66)#24,760 |
| 77. | 82242 | 9.1% | 13.1% (-4.01)#77 | 13.9% (-4.84)#25,049 |
| 78. | 82835 | 9.0% | 13.1% (-4.10)#78 | 13.9% (-4.94)#25,170 |
| 79. | 82334 | 9.0% | 13.1% (-4.15)#79 | 13.9% (-4.99)#25,237 |
| 80. | 82939 | 8.6% | 13.1% (-4.50)#80 | 13.9% (-5.34)#25,746 |
| 81. | 82420 | 8.5% | 13.1% (-4.57)#81 | 13.9% (-5.41)#25,856 |
| 82. | 82836 | 8.5% | 13.1% (-4.62)#82 | 13.9% (-5.46)#25,922 |
| 83. | 82937 | 8.4% | 13.1% (-4.72)#83 | 13.9% (-5.56)#26,052 |
| 84. | 82053 | 8.4% | 13.1% (-4.72)#84 | 13.9% (-5.56)#26,053 |
| 85. | 82054 | 8.2% | 13.1% (-4.87)#85 | 13.9% (-5.71)#26,240 |
| 86. | 82933 | 8.0% | 13.1% (-5.07)#86 | 13.9% (-5.91)#26,451 |
| 87. | 82210 | 7.9% | 13.1% (-5.23)#87 | 13.9% (-6.07)#26,644 |
| 88. | 83128 | 7.6% | 13.1% (-5.46)#88 | 13.9% (-6.30)#26,864 |
| 89. | 82620 | 7.4% | 13.1% (-5.66)#89 | 13.9% (-6.50)#27,068 |
| 90. | 82325 | 7.4% | 13.1% (-5.74)#90 | 13.9% (-6.58)#27,139 |
| 91. | 82201 | 6.9% | 13.1% (-6.15)#91 | 13.9% (-6.99)#27,560 |
| 92. | 83001 | 6.8% | 13.1% (-6.26)#92 | 13.9% (-7.10)#27,645 |
| 93. | 82301 | 6.8% | 13.1% (-6.26)#93 | 13.9% (-7.10)#27,650 |
| 94. | 82433 | 6.8% | 13.1% (-6.27)#94 | 13.9% (-7.11)#27,657 |
| 95. | 82322 | 6.8% | 13.1% (-6.28)#95 | 13.9% (-7.12)#27,668 |
| 96. | 82222 | 6.6% | 13.1% (-6.48)#96 | 13.9% (-7.32)#27,864 |
| 97. | 82721 | 6.4% | 13.1% (-6.69)#97 | 13.9% (-7.53)#28,029 |
| 98. | 82635 | 6.4% | 13.1% (-6.71)#98 | 13.9% (-7.55)#28,043 |
| 99. | 82329 | 6.2% | 13.1% (-6.85)#99 | 13.9% (-7.69)#28,164 |
| 100. | 82716 | 5.3% | 13.1% (-7.78)#100 | 13.9% (-8.62)#28,873 |
1
2Common Questions
What are the Top 10 Zip Codes with the Highest Percentage of Population Employed in Health Care & Social Assistance in Wyoming?
Top 10 Zip Codes with the Highest Percentage of Population Employed in Health Care & Social Assistance in Wyoming are:
What zip code has the Highest Percentage of Population Employed in Health Care & Social Assistance in Wyoming?
83119 has the Highest Percentage of Population Employed in Health Care & Social Assistance in Wyoming with 100.0%.
What is the Percentage of Population Employed in Health Care & Social Assistance in the State of Wyoming?
Percentage of Population Employed in Health Care & Social Assistance in Wyoming is 13.1%.
What is the Percentage of Population Employed in Health Care & Social Assistance in the United States?
Percentage of Population Employed in Health Care & Social Assistance in the United States is 13.9%.