Zip Codes with the Highest Percentage of Population Employed in Agriculture, Fishing & Hunting in Port Orchard, WA
RELATED REPORTS & OPTIONS
Agriculture, Fishing & Hunting
Port Orchard
Compare Zip Codes
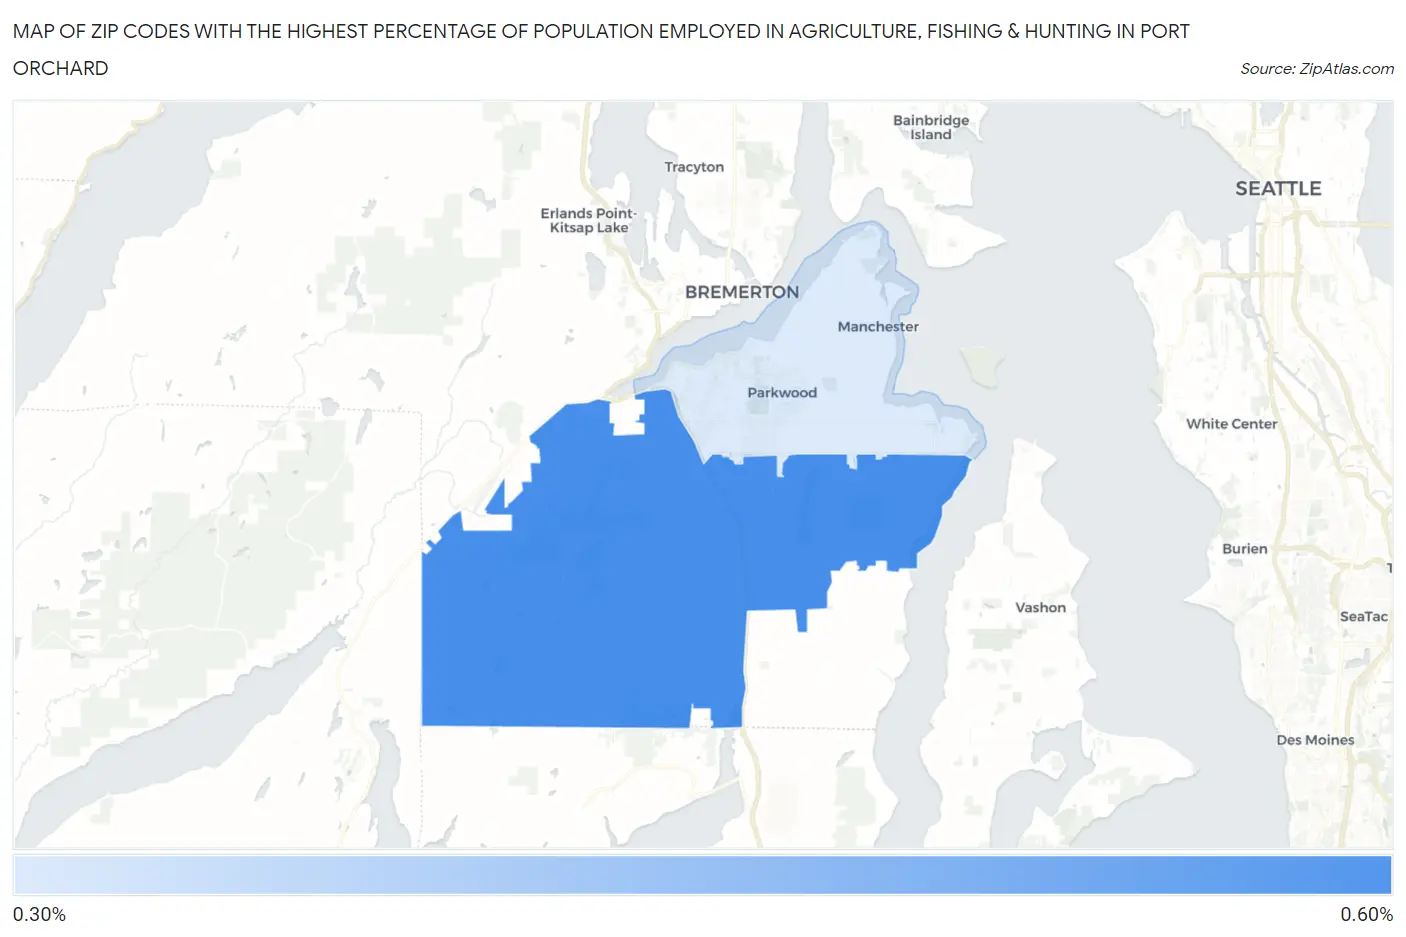
Map of Zip Codes with the Highest Percentage of Population Employed in Agriculture, Fishing & Hunting in Port Orchard
0.34%
0.55%
Zip Codes with the Highest Percentage of Population Employed in Agriculture, Fishing & Hunting in Port Orchard, WA
| Zip Code | % Employed | vs State | vs National | |
| 1. | 98367 | 0.55% | 2.4%(-1.84)#404 | 1.2%(-0.651)#18,863 |
| 2. | 98366 | 0.34% | 2.4%(-2.05)#443 | 1.2%(-0.860)#20,755 |
1
Common Questions
What are the Top Zip Codes with the Highest Percentage of Population Employed in Agriculture, Fishing & Hunting in Port Orchard, WA?
Top Zip Codes with the Highest Percentage of Population Employed in Agriculture, Fishing & Hunting in Port Orchard, WA are:
What zip code has the Highest Percentage of Population Employed in Agriculture, Fishing & Hunting in Port Orchard, WA?
98367 has the Highest Percentage of Population Employed in Agriculture, Fishing & Hunting in Port Orchard, WA with 0.55%.
What is the Percentage of Population Employed in Agriculture, Fishing & Hunting in Washington?
Percentage of Population Employed in Agriculture, Fishing & Hunting in Washington is 2.4%.
What is the Percentage of Population Employed in Agriculture, Fishing & Hunting in the United States?
Percentage of Population Employed in Agriculture, Fishing & Hunting in the United States is 1.2%.