Zip Codes with the Highest Percentage of Population Employed in Agriculture, Fishing & Hunting in Burlington, VT
RELATED REPORTS & OPTIONS
Agriculture, Fishing & Hunting
Burlington
Compare Zip Codes
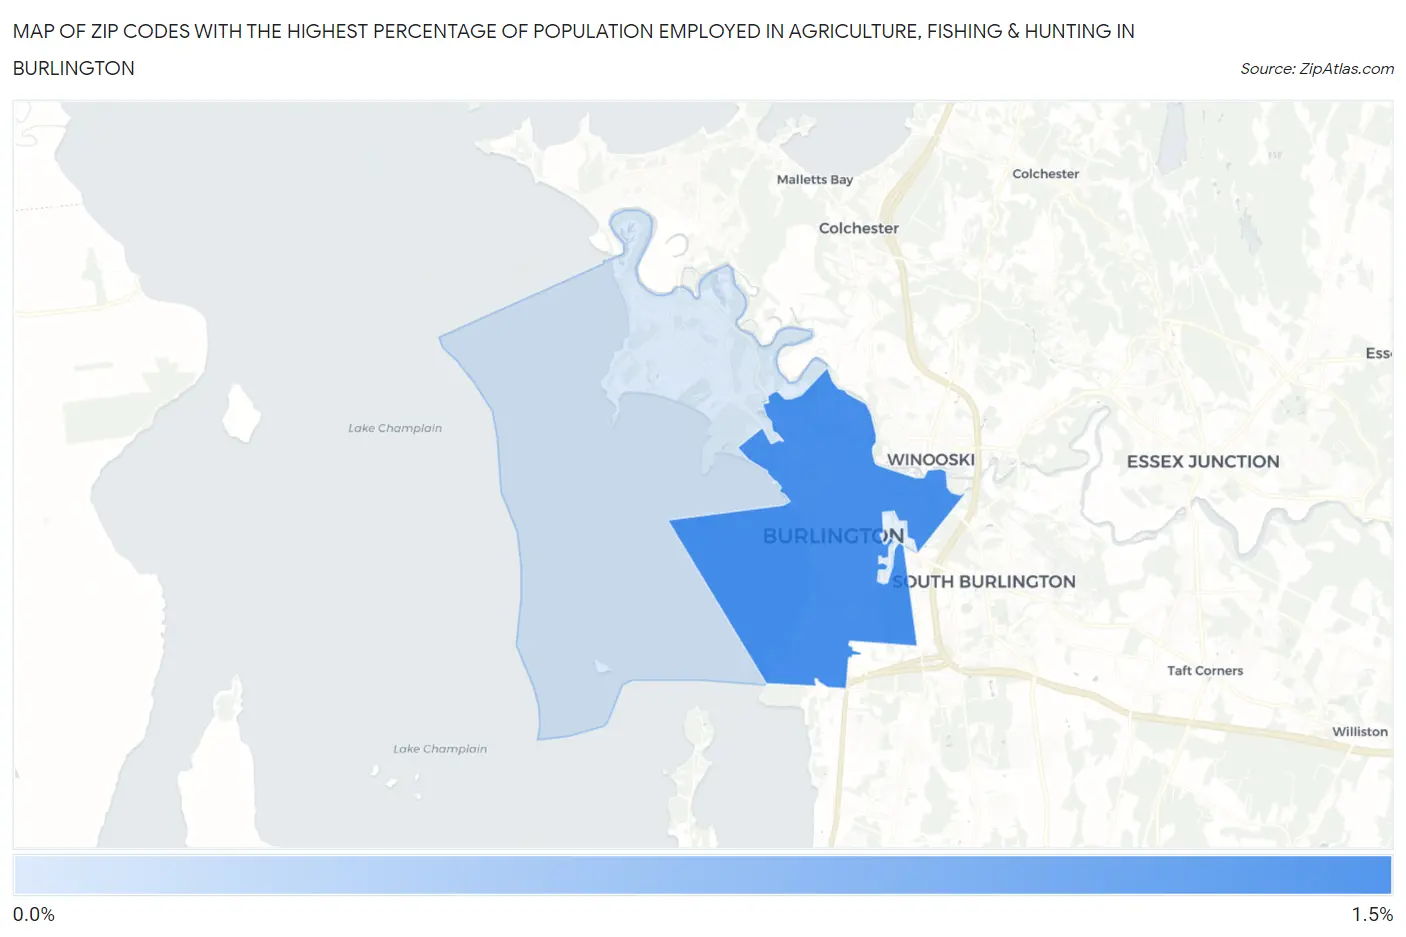
Map of Zip Codes with the Highest Percentage of Population Employed in Agriculture, Fishing & Hunting in Burlington
0.26%
1.3%
Zip Codes with the Highest Percentage of Population Employed in Agriculture, Fishing & Hunting in Burlington, VT
| Zip Code | % Employed | vs State | vs National | |
| 1. | 05401 | 1.3% | 2.4%(-1.18)#161 | 1.2%(+0.062)#15,173 |
| 2. | 05408 | 0.26% | 2.4%(-2.18)#197 | 1.2%(-0.944)#21,700 |
1
Common Questions
What are the Top Zip Codes with the Highest Percentage of Population Employed in Agriculture, Fishing & Hunting in Burlington, VT?
Top Zip Codes with the Highest Percentage of Population Employed in Agriculture, Fishing & Hunting in Burlington, VT are:
What zip code has the Highest Percentage of Population Employed in Agriculture, Fishing & Hunting in Burlington, VT?
05401 has the Highest Percentage of Population Employed in Agriculture, Fishing & Hunting in Burlington, VT with 1.3%.
What is the Percentage of Population Employed in Agriculture, Fishing & Hunting in Burlington, VT?
Percentage of Population Employed in Agriculture, Fishing & Hunting in Burlington is 1.0%.
What is the Percentage of Population Employed in Agriculture, Fishing & Hunting in Vermont?
Percentage of Population Employed in Agriculture, Fishing & Hunting in Vermont is 2.4%.
What is the Percentage of Population Employed in Agriculture, Fishing & Hunting in the United States?
Percentage of Population Employed in Agriculture, Fishing & Hunting in the United States is 1.2%.