Zip Codes with the Highest Percentage of Population Employed in Life, Physical & Social Science in Burlington, VT
RELATED REPORTS & OPTIONS
Life, Physical & Social Science
Burlington
Compare Zip Codes
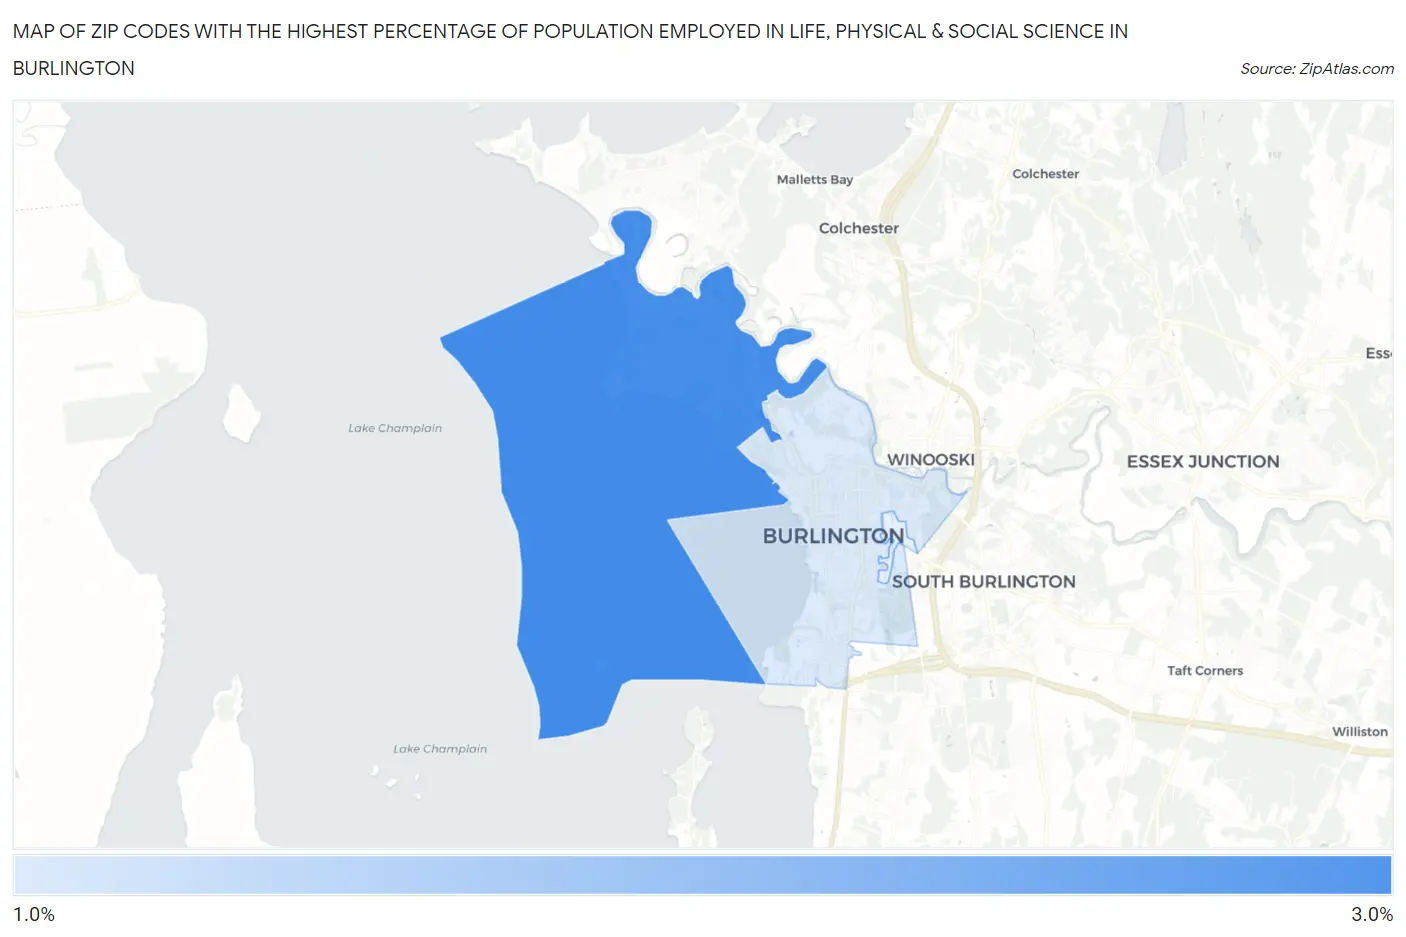
Map of Zip Codes with the Highest Percentage of Population Employed in Life, Physical & Social Science in Burlington
1.8%
2.8%
Zip Codes with the Highest Percentage of Population Employed in Life, Physical & Social Science in Burlington, VT
| Zip Code | % Employed | vs State | vs National | |
| 1. | 05408 | 2.8% | 1.2%(+1.56)#22 | 1.1%(+1.67)#2,166 |
| 2. | 05401 | 1.8% | 1.2%(+0.637)#47 | 1.1%(+0.740)#4,212 |
1
Common Questions
What are the Top Zip Codes with the Highest Percentage of Population Employed in Life, Physical & Social Science in Burlington, VT?
Top Zip Codes with the Highest Percentage of Population Employed in Life, Physical & Social Science in Burlington, VT are:
What zip code has the Highest Percentage of Population Employed in Life, Physical & Social Science in Burlington, VT?
05408 has the Highest Percentage of Population Employed in Life, Physical & Social Science in Burlington, VT with 2.8%.
What is the Percentage of Population Employed in Life, Physical & Social Science in Burlington, VT?
Percentage of Population Employed in Life, Physical & Social Science in Burlington is 2.0%.
What is the Percentage of Population Employed in Life, Physical & Social Science in Vermont?
Percentage of Population Employed in Life, Physical & Social Science in Vermont is 1.2%.
What is the Percentage of Population Employed in Life, Physical & Social Science in the United States?
Percentage of Population Employed in Life, Physical & Social Science in the United States is 1.1%.