Zip Codes with the Highest Percentage of Hispanic or Latino Population in Tyler, TX
RELATED REPORTS & OPTIONS
Hispanic or Latino
Tyler
Compare Zip Codes
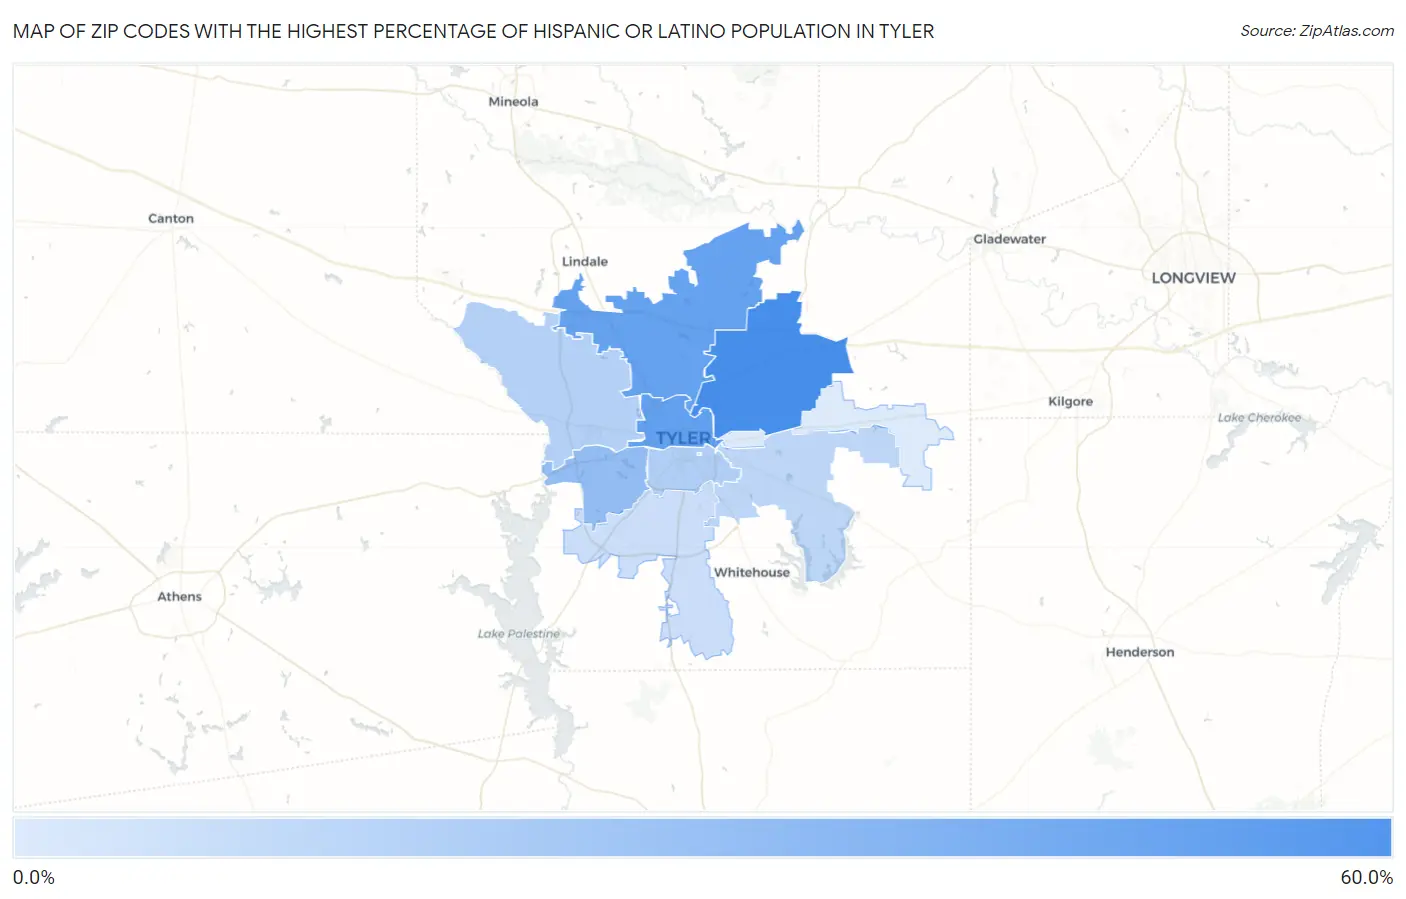
Map of Zip Codes with the Highest Percentage of Hispanic or Latino Population in Tyler
3.2%
59.9%
Zip Codes with the Highest Percentage of Hispanic or Latino Population in Tyler, TX
| Zip Code | Hispanic or Latino | vs State | vs National | |
| 1. | 75708 | 59.9% | 39.9%(+20.0)#331 | 18.7%(+41.2)#1,108 |
| 2. | 75702 | 47.1% | 39.9%(+7.19)#494 | 18.7%(+28.4)#1,698 |
| 3. | 75706 | 46.1% | 39.9%(+6.25)#514 | 18.7%(+27.5)#1,754 |
| 4. | 75709 | 28.2% | 39.9%(-11.7)#864 | 18.7%(+9.57)#3,314 |
| 5. | 75711 | 20.9% | 39.9%(-19.0)#1,103 | 18.7%(+2.21)#4,586 |
| 6. | 75701 | 17.1% | 39.9%(-22.8)#1,256 | 18.7%(-1.54)#5,607 |
| 7. | 75704 | 16.4% | 39.9%(-23.5)#1,279 | 18.7%(-2.24)#5,833 |
| 8. | 75707 | 13.2% | 39.9%(-26.6)#1,415 | 18.7%(-5.40)#7,126 |
| 9. | 75703 | 9.3% | 39.9%(-30.6)#1,576 | 18.7%(-9.40)#9,486 |
| 10. | 75705 | 3.2% | 39.9%(-36.7)#1,763 | 18.7%(-15.4)#17,764 |
1
Common Questions
What are the Top 5 Zip Codes with the Highest Percentage of Hispanic or Latino Population in Tyler, TX?
Top 5 Zip Codes with the Highest Percentage of Hispanic or Latino Population in Tyler, TX are:
What zip code has the Highest Percentage of Hispanic or Latino Population in Tyler, TX?
75708 has the Highest Percentage of Hispanic or Latino Population in Tyler, TX with 59.9%.
What is the Percentage of Hispanic or Latino Population in Tyler, TX?
Percentage of Hispanic or Latino Population in Tyler is 21.7%.
What is the Percentage of Hispanic or Latino Population in Texas?
Percentage of Hispanic or Latino Population in Texas is 39.9%.
What is the Percentage of Hispanic or Latino Population in the United States?
Percentage of Hispanic or Latino Population in the United States is 18.7%.