Zip Codes with the Highest Percentage of Population Employed in Health Diagnosing & Treating in Tyler, TX
RELATED REPORTS & OPTIONS
Health Diagnosing & Treating
Tyler
Compare Zip Codes
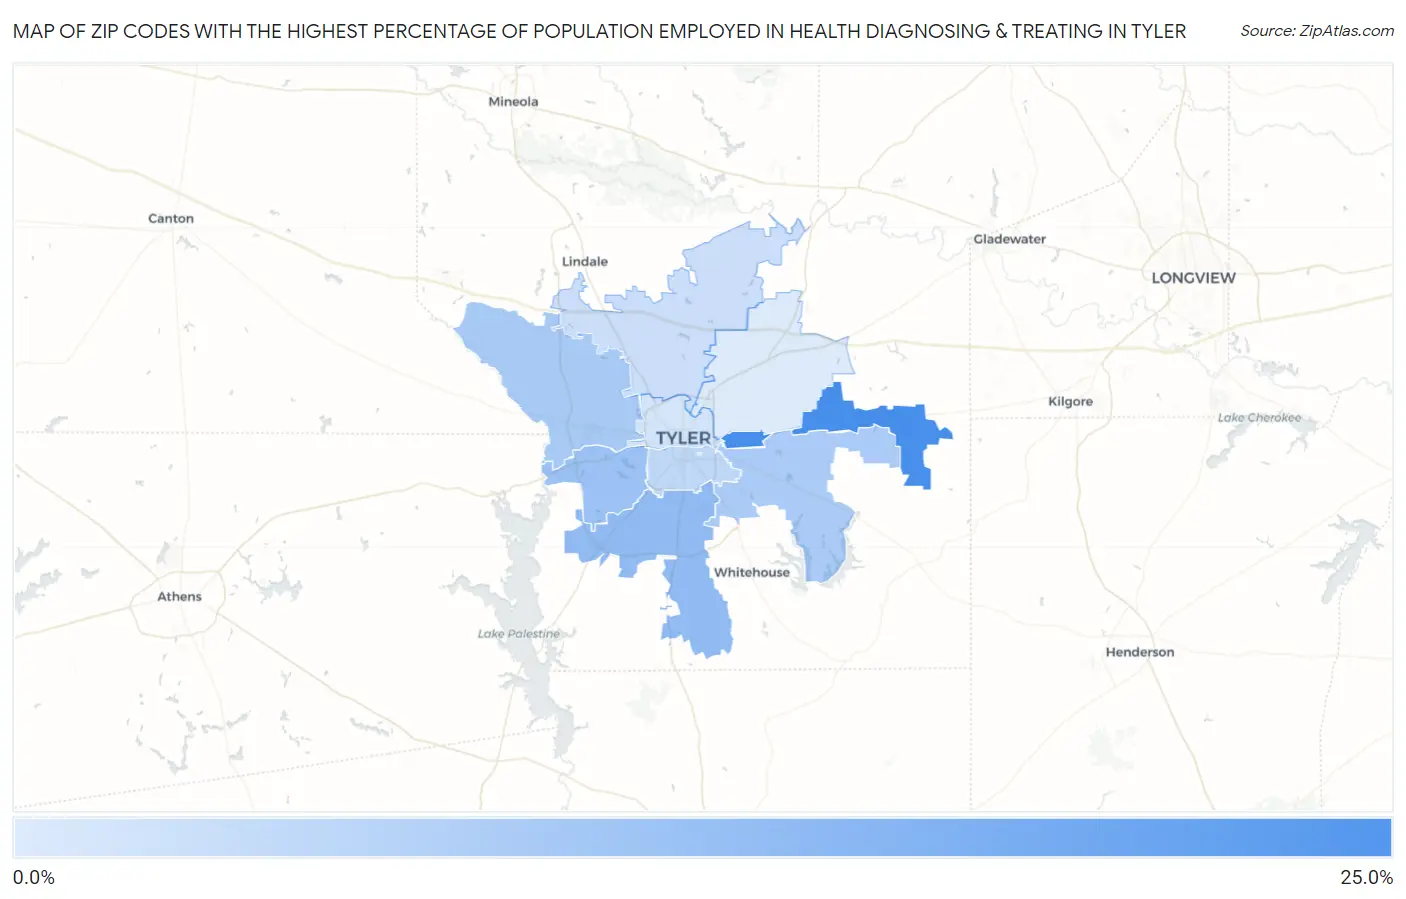
Map of Zip Codes with the Highest Percentage of Population Employed in Health Diagnosing & Treating in Tyler
2.7%
24.7%
Zip Codes with the Highest Percentage of Population Employed in Health Diagnosing & Treating in Tyler, TX
| Zip Code | % Employed | vs State | vs National | |
| 1. | 75705 | 24.7% | 5.5%(+19.2)#20 | 6.2%(+18.4)#340 |
| 2. | 75703 | 13.3% | 5.5%(+7.75)#76 | 6.2%(+7.02)#1,648 |
| 3. | 75709 | 11.5% | 5.5%(+5.95)#106 | 6.2%(+5.22)#2,549 |
| 4. | 75704 | 10.0% | 5.5%(+4.50)#162 | 6.2%(+3.77)#3,867 |
| 5. | 75707 | 9.7% | 5.5%(+4.16)#183 | 6.2%(+3.43)#4,291 |
| 6. | 75701 | 6.7% | 5.5%(+1.16)#485 | 6.2%(+0.434)#11,383 |
| 7. | 75706 | 5.2% | 5.5%(-0.337)#781 | 6.2%(-1.06)#16,993 |
| 8. | 75702 | 4.0% | 5.5%(-1.51)#1,064 | 6.2%(-2.23)#21,341 |
| 9. | 75708 | 2.7% | 5.5%(-2.85)#1,350 | 6.2%(-3.57)#25,112 |
1
Common Questions
What are the Top 5 Zip Codes with the Highest Percentage of Population Employed in Health Diagnosing & Treating in Tyler, TX?
Top 5 Zip Codes with the Highest Percentage of Population Employed in Health Diagnosing & Treating in Tyler, TX are:
What zip code has the Highest Percentage of Population Employed in Health Diagnosing & Treating in Tyler, TX?
75705 has the Highest Percentage of Population Employed in Health Diagnosing & Treating in Tyler, TX with 24.7%.
What is the Percentage of Population Employed in Health Diagnosing & Treating in Tyler, TX?
Percentage of Population Employed in Health Diagnosing & Treating in Tyler is 9.4%.
What is the Percentage of Population Employed in Health Diagnosing & Treating in Texas?
Percentage of Population Employed in Health Diagnosing & Treating in Texas is 5.5%.
What is the Percentage of Population Employed in Health Diagnosing & Treating in the United States?
Percentage of Population Employed in Health Diagnosing & Treating in the United States is 6.2%.