Zip Codes with the Highest Percentage of Households with Income Below $10,000 in Tyler, TX
RELATED REPORTS & OPTIONS
Household Income | $0-10k
Tyler
Compare Zip Codes
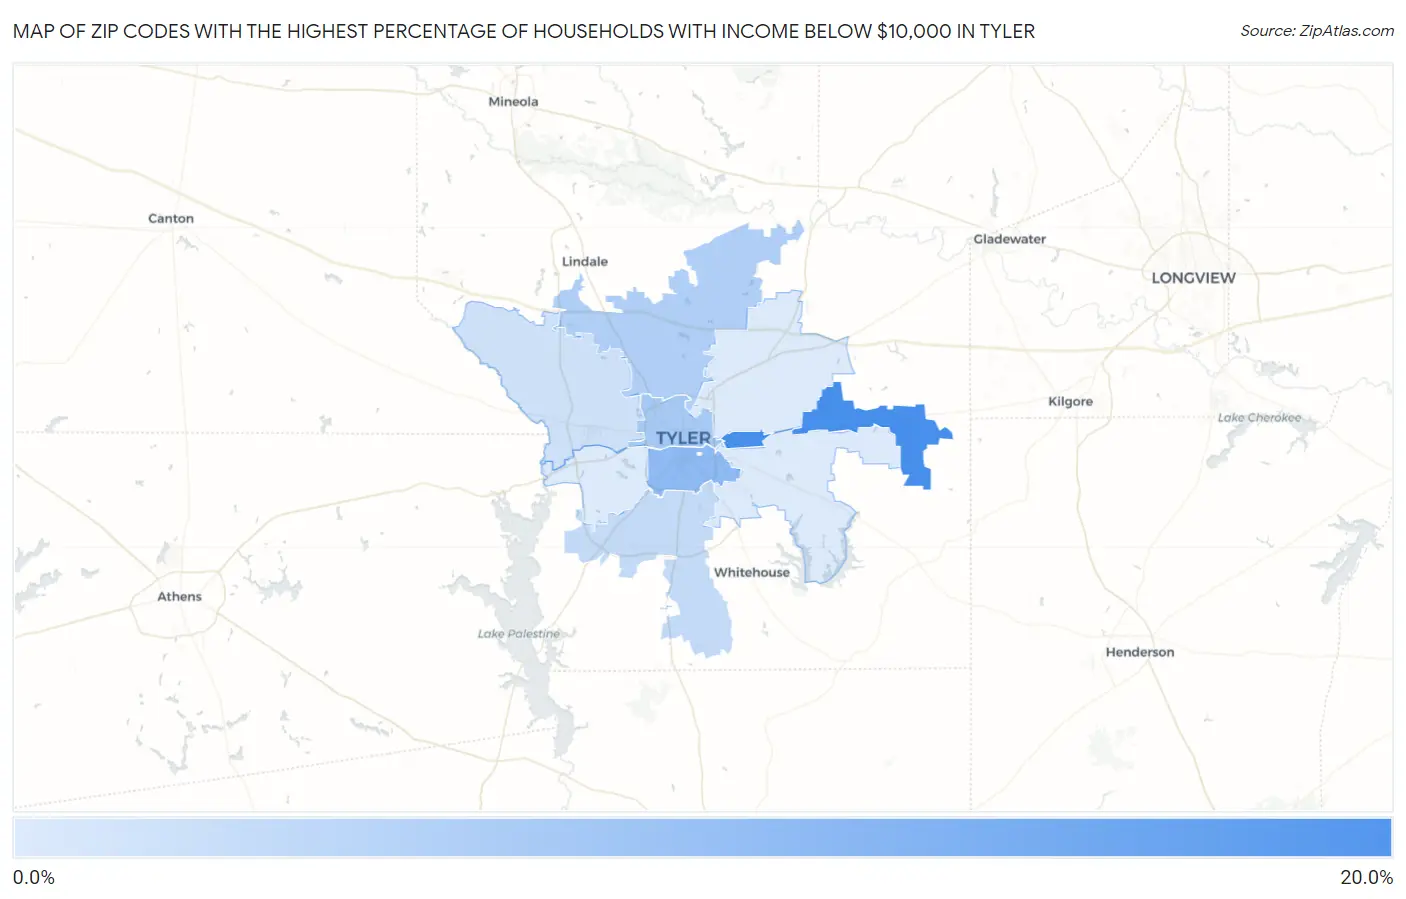
Map of Zip Codes with the Highest Percentage of Households with Income Below $10,000 in Tyler
1.7%
16.4%
Zip Codes with the Highest Percentage of Households with Income Below $10,000 in Tyler, TX
| Zip Code | Households with Income < $10k | vs State | vs National | |
| 1. | 75705 | 16.4% | 5.1%(+11.3)#61 | 4.9%(+11.5)#1,264 |
| 2. | 75701 | 9.2% | 5.1%(+4.10)#269 | 4.9%(+4.30)#4,201 |
| 3. | 75702 | 6.6% | 5.1%(+1.50)#533 | 4.9%(+1.70)#7,724 |
| 4. | 75706 | 5.8% | 5.1%(+0.700)#645 | 4.9%(+0.900)#9,537 |
| 5. | 75703 | 4.1% | 5.1%(-1.00)#949 | 4.9%(-0.800)#14,810 |
| 6. | 75704 | 2.9% | 5.1%(-2.20)#1,233 | 4.9%(-2.00)#19,962 |
| 7. | 75708 | 1.8% | 5.1%(-3.30)#1,481 | 4.9%(-3.10)#24,437 |
| 8. | 75709 | 1.8% | 5.1%(-3.30)#1,485 | 4.9%(-3.10)#24,486 |
| 9. | 75707 | 1.7% | 5.1%(-3.40)#1,502 | 4.9%(-3.20)#24,767 |
1
Common Questions
What are the Top 5 Zip Codes with the Highest Percentage of Households with Income Below $10,000 in Tyler, TX?
Top 5 Zip Codes with the Highest Percentage of Households with Income Below $10,000 in Tyler, TX are:
What zip code has the Highest Percentage of Households with Income Below $10,000 in Tyler, TX?
75705 has the Highest Percentage of Households with Income Below $10,000 in Tyler, TX with 16.4%.
What is the Percentage of Households with Income Below $10,000 in Tyler, TX?
Percentage of Households with Income Below $10,000 in Tyler is 6.0%.
What is the Percentage of Households with Income Below $10,000 in Texas?
Percentage of Households with Income Below $10,000 in Texas is 5.1%.
What is the Percentage of Households with Income Below $10,000 in the United States?
Percentage of Households with Income Below $10,000 in the United States is 4.9%.