Zip Codes with the Highest Percentage of Population Employed in Agriculture, Fishing & Hunting in Corsicana, TX
RELATED REPORTS & OPTIONS
Agriculture, Fishing & Hunting
Corsicana
Compare Zip Codes
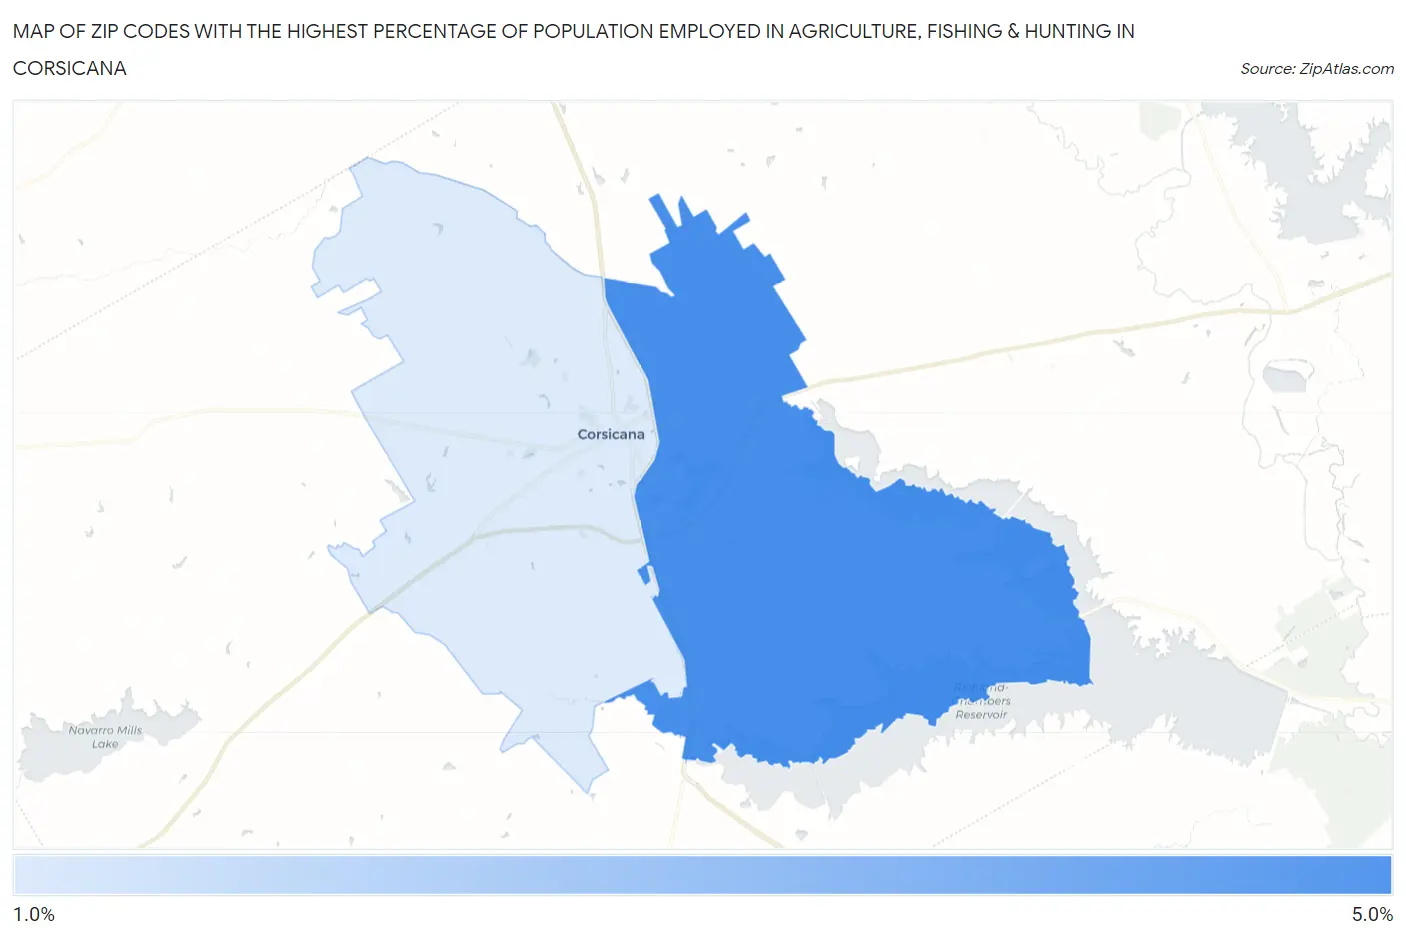
Map of Zip Codes with the Highest Percentage of Population Employed in Agriculture, Fishing & Hunting in Corsicana
1.6%
4.5%
Zip Codes with the Highest Percentage of Population Employed in Agriculture, Fishing & Hunting in Corsicana, TX
| Zip Code | % Employed | vs State | vs National | |
| 1. | 75109 | 4.5% | 0.75%(+3.70)#446 | 1.2%(+3.25)#8,459 |
| 2. | 75110 | 1.6% | 0.75%(+0.858)#728 | 1.2%(+0.410)#13,946 |
1
Common Questions
What are the Top Zip Codes with the Highest Percentage of Population Employed in Agriculture, Fishing & Hunting in Corsicana, TX?
Top Zip Codes with the Highest Percentage of Population Employed in Agriculture, Fishing & Hunting in Corsicana, TX are:
What zip code has the Highest Percentage of Population Employed in Agriculture, Fishing & Hunting in Corsicana, TX?
75109 has the Highest Percentage of Population Employed in Agriculture, Fishing & Hunting in Corsicana, TX with 4.5%.
What is the Percentage of Population Employed in Agriculture, Fishing & Hunting in Corsicana, TX?
Percentage of Population Employed in Agriculture, Fishing & Hunting in Corsicana is 1.4%.
What is the Percentage of Population Employed in Agriculture, Fishing & Hunting in Texas?
Percentage of Population Employed in Agriculture, Fishing & Hunting in Texas is 0.75%.
What is the Percentage of Population Employed in Agriculture, Fishing & Hunting in the United States?
Percentage of Population Employed in Agriculture, Fishing & Hunting in the United States is 1.2%.