Zip Codes with the Highest Percentage of Population Employed in Professional & Scientific Services in Corsicana, TX
RELATED REPORTS & OPTIONS
Professional & Scientific Services
Corsicana
Compare Zip Codes
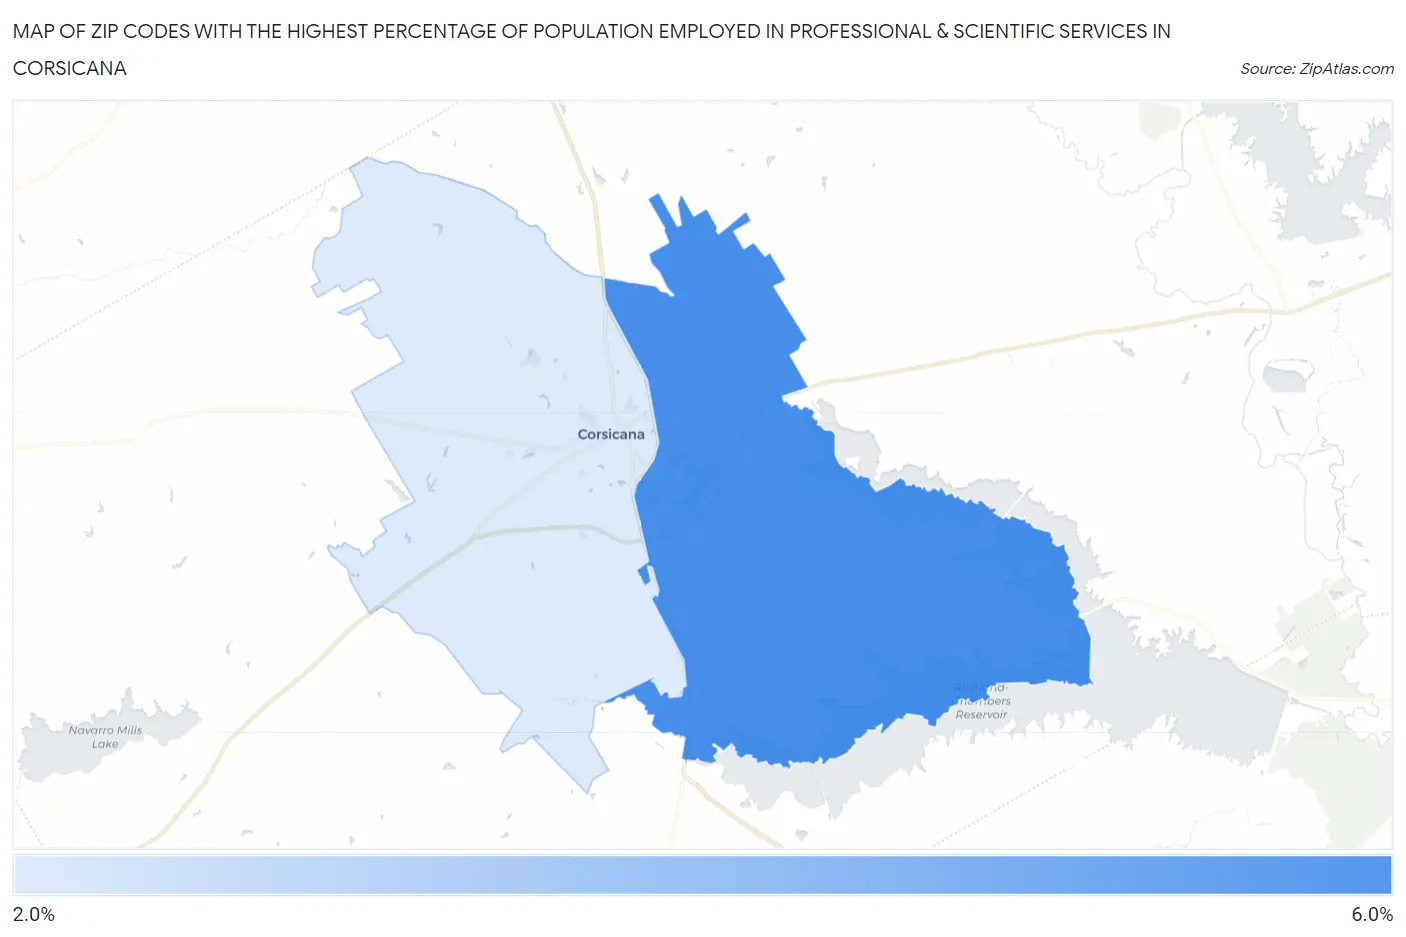
Map of Zip Codes with the Highest Percentage of Population Employed in Professional & Scientific Services in Corsicana
2.8%
5.6%
Zip Codes with the Highest Percentage of Population Employed in Professional & Scientific Services in Corsicana, TX
| Zip Code | % Employed | vs State | vs National | |
| 1. | 75109 | 5.6% | 7.6%(-2.00)#606 | 7.8%(-2.25)#10,843 |
| 2. | 75110 | 2.8% | 7.6%(-4.82)#1,134 | 7.8%(-5.07)#19,220 |
1
Common Questions
What are the Top Zip Codes with the Highest Percentage of Population Employed in Professional & Scientific Services in Corsicana, TX?
Top Zip Codes with the Highest Percentage of Population Employed in Professional & Scientific Services in Corsicana, TX are:
What zip code has the Highest Percentage of Population Employed in Professional & Scientific Services in Corsicana, TX?
75109 has the Highest Percentage of Population Employed in Professional & Scientific Services in Corsicana, TX with 5.6%.
What is the Percentage of Population Employed in Professional & Scientific Services in Corsicana, TX?
Percentage of Population Employed in Professional & Scientific Services in Corsicana is 2.2%.
What is the Percentage of Population Employed in Professional & Scientific Services in Texas?
Percentage of Population Employed in Professional & Scientific Services in Texas is 7.6%.
What is the Percentage of Population Employed in Professional & Scientific Services in the United States?
Percentage of Population Employed in Professional & Scientific Services in the United States is 7.8%.