Zip Codes with the Highest Percentage of Immigrants from Latin America in Corsicana, TX
RELATED REPORTS & OPTIONS
Latin America
Corsicana
Compare Zip Codes
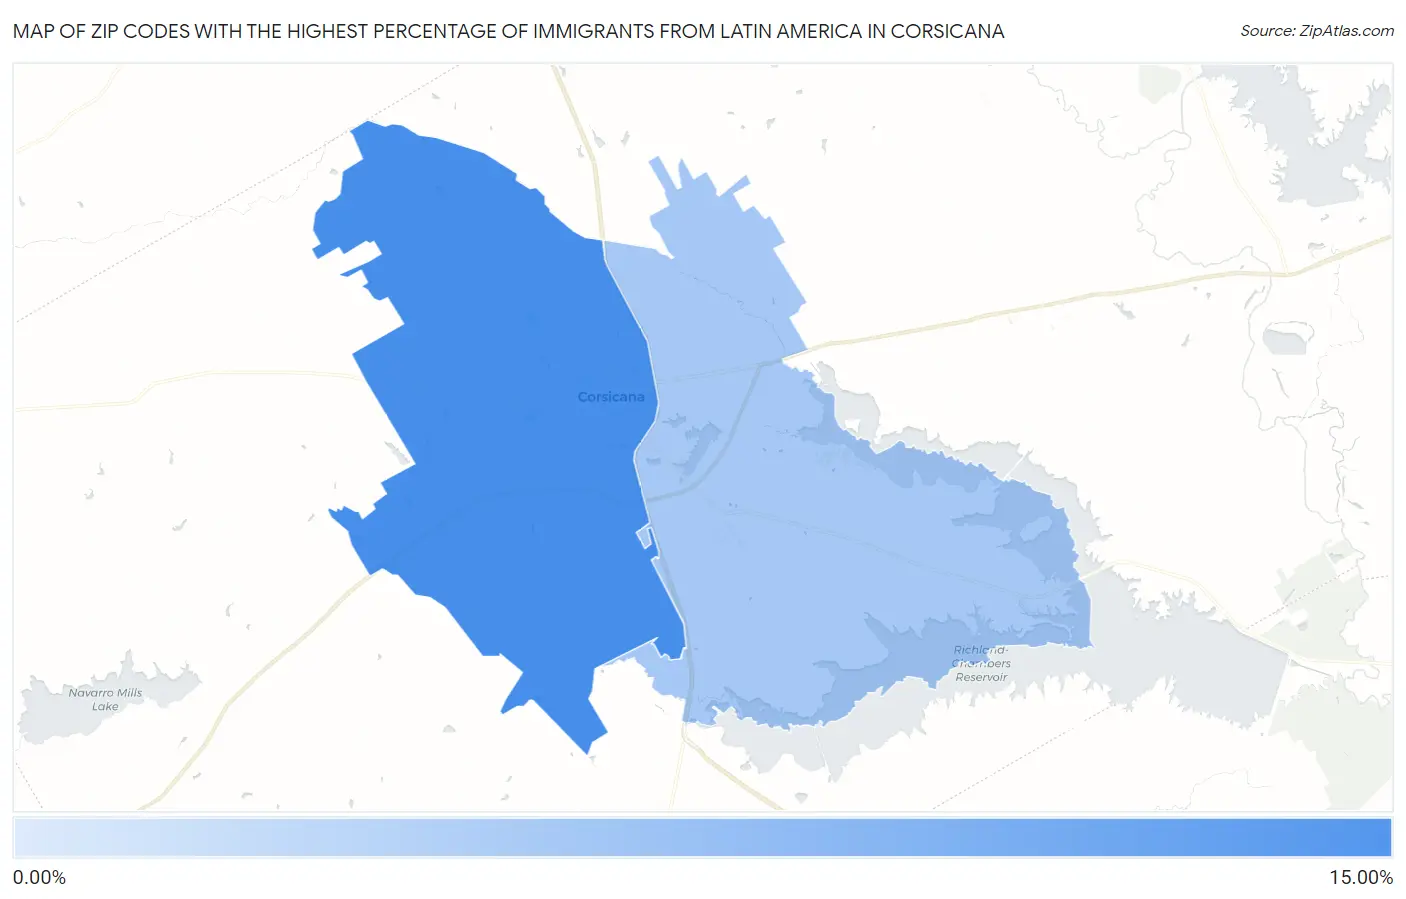
Map of Zip Codes with the Highest Percentage of Immigrants from Latin America in Corsicana
5.02%
14.19%
Zip Codes with the Highest Percentage of Immigrants from Latin America in Corsicana, TX
| Zip Code | Latin America | vs State | vs National | |
| 1. | 75110 | 14.19% | 11.14%(+3.05)#3 | 6.84%(+7.35)#109 |
| 2. | 75109 | 5.02% | 11.14%(-6.12)#4 | 6.84%(-1.83)#110 |
1
Common Questions
What are the Top Zip Codes with the Highest Percentage of Immigrants from Latin America in Corsicana, TX?
Top Zip Codes with the Highest Percentage of Immigrants from Latin America in Corsicana, TX are:
What zip code has the Highest Percentage of Immigrants from Latin America in Corsicana, TX?
75110 has the Highest Percentage of Immigrants from Latin America in Corsicana, TX with 14.19%.
What is the Percentage of Immigrants from Latin America in Corsicana, TX?
Percentage of Immigrants from Latin America in Corsicana is 14.00%.
What is the Percentage of Immigrants from Latin America in Texas?
Percentage of Immigrants from Latin America in Texas is 11.14%.
What is the Percentage of Immigrants from Latin America in the United States?
Percentage of Immigrants from Latin America in the United States is 6.84%.