Zip Codes with the Highest Percentage of Population Employed in Health Diagnosing & Treating in Corsicana, TX
RELATED REPORTS & OPTIONS
Health Diagnosing & Treating
Corsicana
Compare Zip Codes
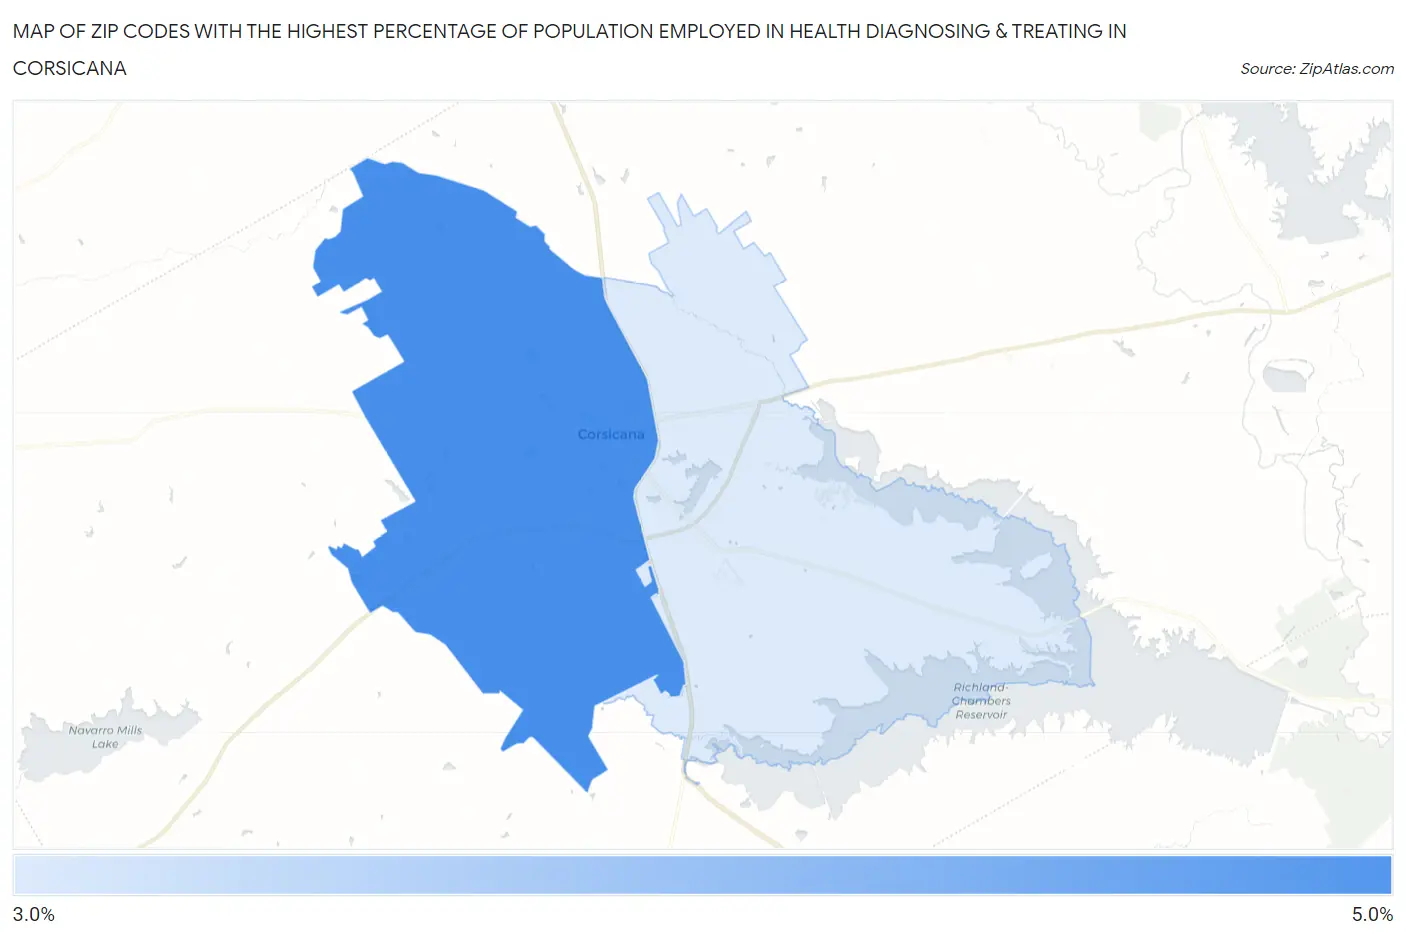
Map of Zip Codes with the Highest Percentage of Population Employed in Health Diagnosing & Treating in Corsicana
3.1%
4.9%
Zip Codes with the Highest Percentage of Population Employed in Health Diagnosing & Treating in Corsicana, TX
| Zip Code | % Employed | vs State | vs National | |
| 1. | 75110 | 4.9% | 5.5%(-0.608)#847 | 6.2%(-1.33)#18,059 |
| 2. | 75109 | 3.1% | 5.5%(-2.43)#1,281 | 6.2%(-3.16)#24,102 |
1
Common Questions
What are the Top Zip Codes with the Highest Percentage of Population Employed in Health Diagnosing & Treating in Corsicana, TX?
Top Zip Codes with the Highest Percentage of Population Employed in Health Diagnosing & Treating in Corsicana, TX are:
What zip code has the Highest Percentage of Population Employed in Health Diagnosing & Treating in Corsicana, TX?
75110 has the Highest Percentage of Population Employed in Health Diagnosing & Treating in Corsicana, TX with 4.9%.
What is the Percentage of Population Employed in Health Diagnosing & Treating in Corsicana, TX?
Percentage of Population Employed in Health Diagnosing & Treating in Corsicana is 4.8%.
What is the Percentage of Population Employed in Health Diagnosing & Treating in Texas?
Percentage of Population Employed in Health Diagnosing & Treating in Texas is 5.5%.
What is the Percentage of Population Employed in Health Diagnosing & Treating in the United States?
Percentage of Population Employed in Health Diagnosing & Treating in the United States is 6.2%.