Zip Codes with the Highest Percentage of Population Employed in Arts, Entertainment & Recreation in Corsicana, TX
RELATED REPORTS & OPTIONS
Arts, Entertainment & Recreation
Corsicana
Compare Zip Codes
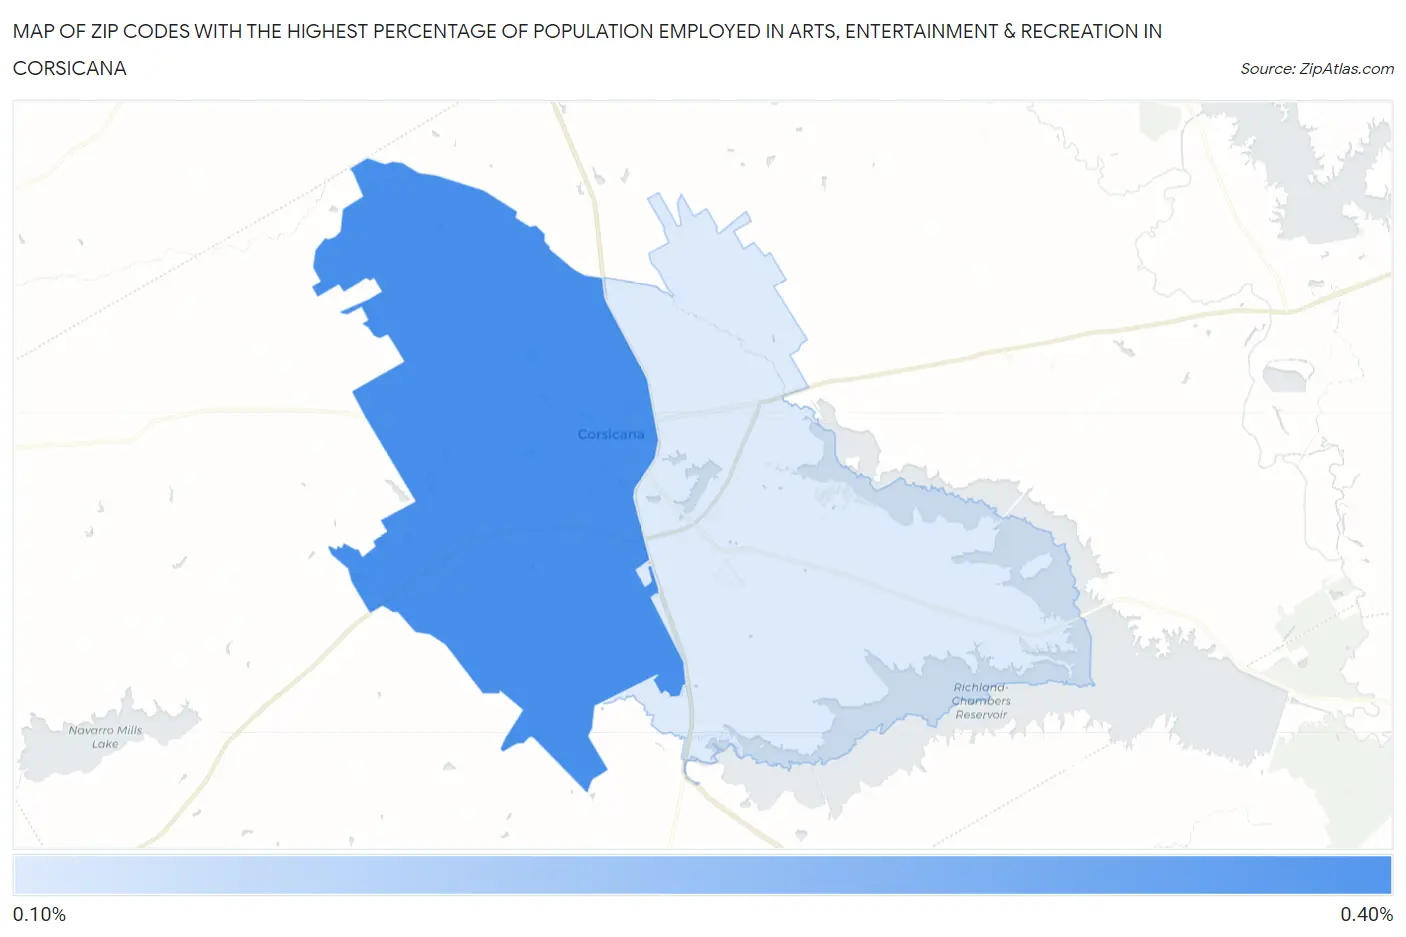
Map of Zip Codes with the Highest Percentage of Population Employed in Arts, Entertainment & Recreation in Corsicana
0.16%
0.35%
Zip Codes with the Highest Percentage of Population Employed in Arts, Entertainment & Recreation in Corsicana, TX
| Zip Code | % Employed | vs State | vs National | |
| 1. | 75110 | 0.35% | 1.5%(-1.11)#1,150 | 2.1%(-1.73)#21,401 |
| 2. | 75109 | 0.16% | 1.5%(-1.31)#1,228 | 2.1%(-1.93)#22,372 |
1
Common Questions
What are the Top Zip Codes with the Highest Percentage of Population Employed in Arts, Entertainment & Recreation in Corsicana, TX?
Top Zip Codes with the Highest Percentage of Population Employed in Arts, Entertainment & Recreation in Corsicana, TX are:
What zip code has the Highest Percentage of Population Employed in Arts, Entertainment & Recreation in Corsicana, TX?
75110 has the Highest Percentage of Population Employed in Arts, Entertainment & Recreation in Corsicana, TX with 0.35%.
What is the Percentage of Population Employed in Arts, Entertainment & Recreation in Corsicana, TX?
Percentage of Population Employed in Arts, Entertainment & Recreation in Corsicana is 0.42%.
What is the Percentage of Population Employed in Arts, Entertainment & Recreation in Texas?
Percentage of Population Employed in Arts, Entertainment & Recreation in Texas is 1.5%.
What is the Percentage of Population Employed in Arts, Entertainment & Recreation in the United States?
Percentage of Population Employed in Arts, Entertainment & Recreation in the United States is 2.1%.