Zip Codes with the Highest Percentage of Population with a Degree in Engineering in Crossville, TN
RELATED REPORTS & OPTIONS
Engineering
Crossville
Compare Zip Codes
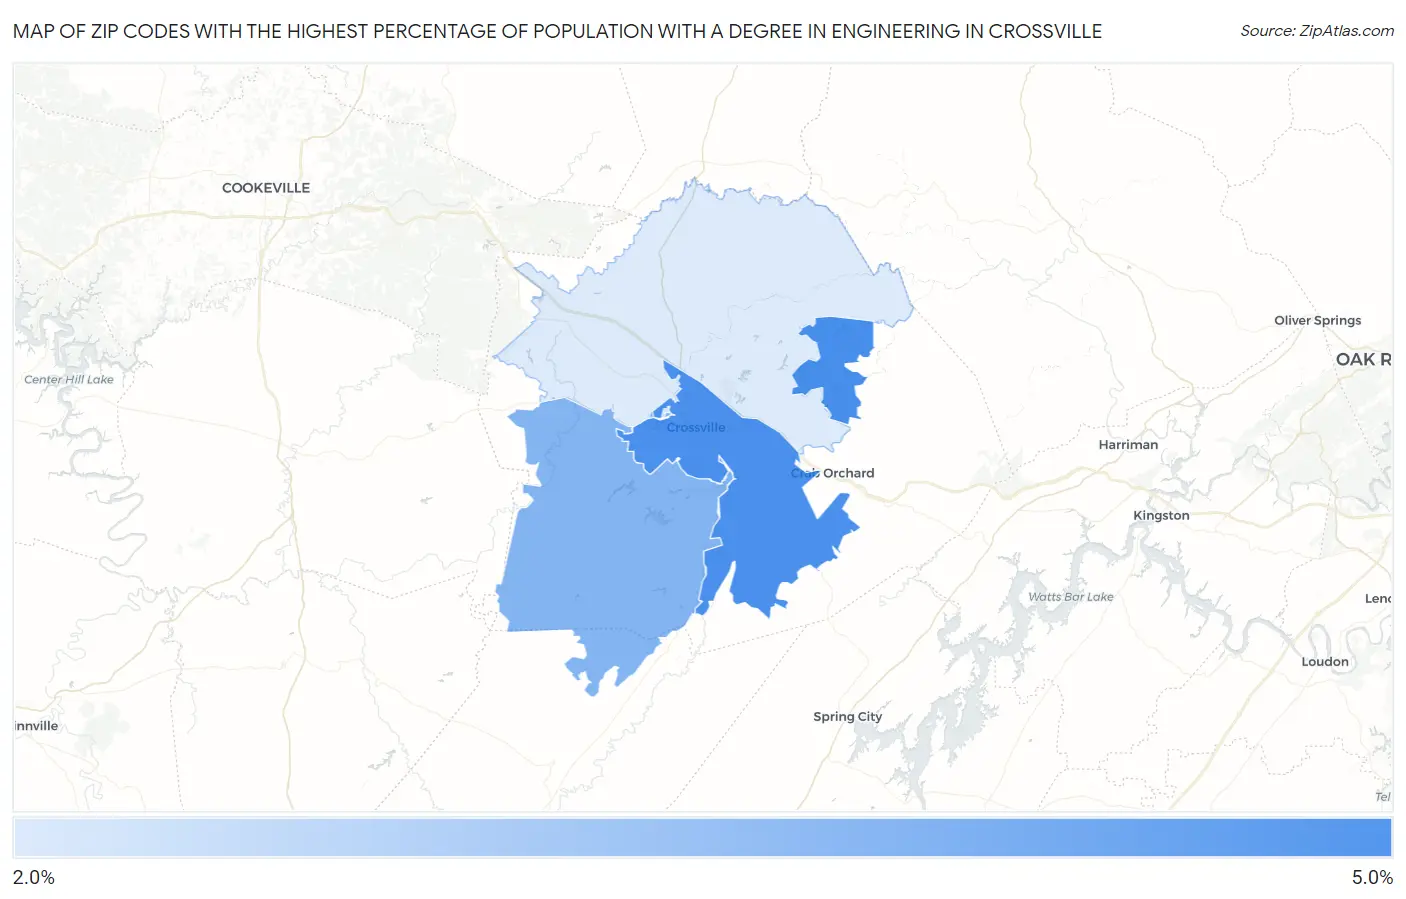
Map of Zip Codes with the Highest Percentage of Population with a Degree in Engineering in Crossville
2.4%
4.7%
Zip Codes with the Highest Percentage of Population with a Degree in Engineering in Crossville, TN
| Zip Code | % Graduates | vs State | vs National | |
| 1. | 38558 | 4.7% | 6.2%(-1.53)#283 | 7.6%(-3.00)#14,658 |
| 2. | 38555 | 4.6% | 6.2%(-1.58)#285 | 7.6%(-3.04)#14,783 |
| 3. | 38572 | 3.8% | 6.2%(-2.42)#334 | 7.6%(-3.89)#16,978 |
| 4. | 38571 | 2.4% | 6.2%(-3.74)#403 | 7.6%(-5.21)#20,107 |
1
Common Questions
What are the Top 3 Zip Codes with the Highest Percentage of Population with a Degree in Engineering in Crossville, TN?
Top 3 Zip Codes with the Highest Percentage of Population with a Degree in Engineering in Crossville, TN are:
What zip code has the Highest Percentage of Population with a Degree in Engineering in Crossville, TN?
38558 has the Highest Percentage of Population with a Degree in Engineering in Crossville, TN with 4.7%.
What is the Percentage of Population with a Degree in Engineering in Crossville, TN?
Percentage of Population with a Degree in Engineering in Crossville is 4.4%.
What is the Percentage of Population with a Degree in Engineering in Tennessee?
Percentage of Population with a Degree in Engineering in Tennessee is 6.2%.
What is the Percentage of Population with a Degree in Engineering in the United States?
Percentage of Population with a Degree in Engineering in the United States is 7.6%.