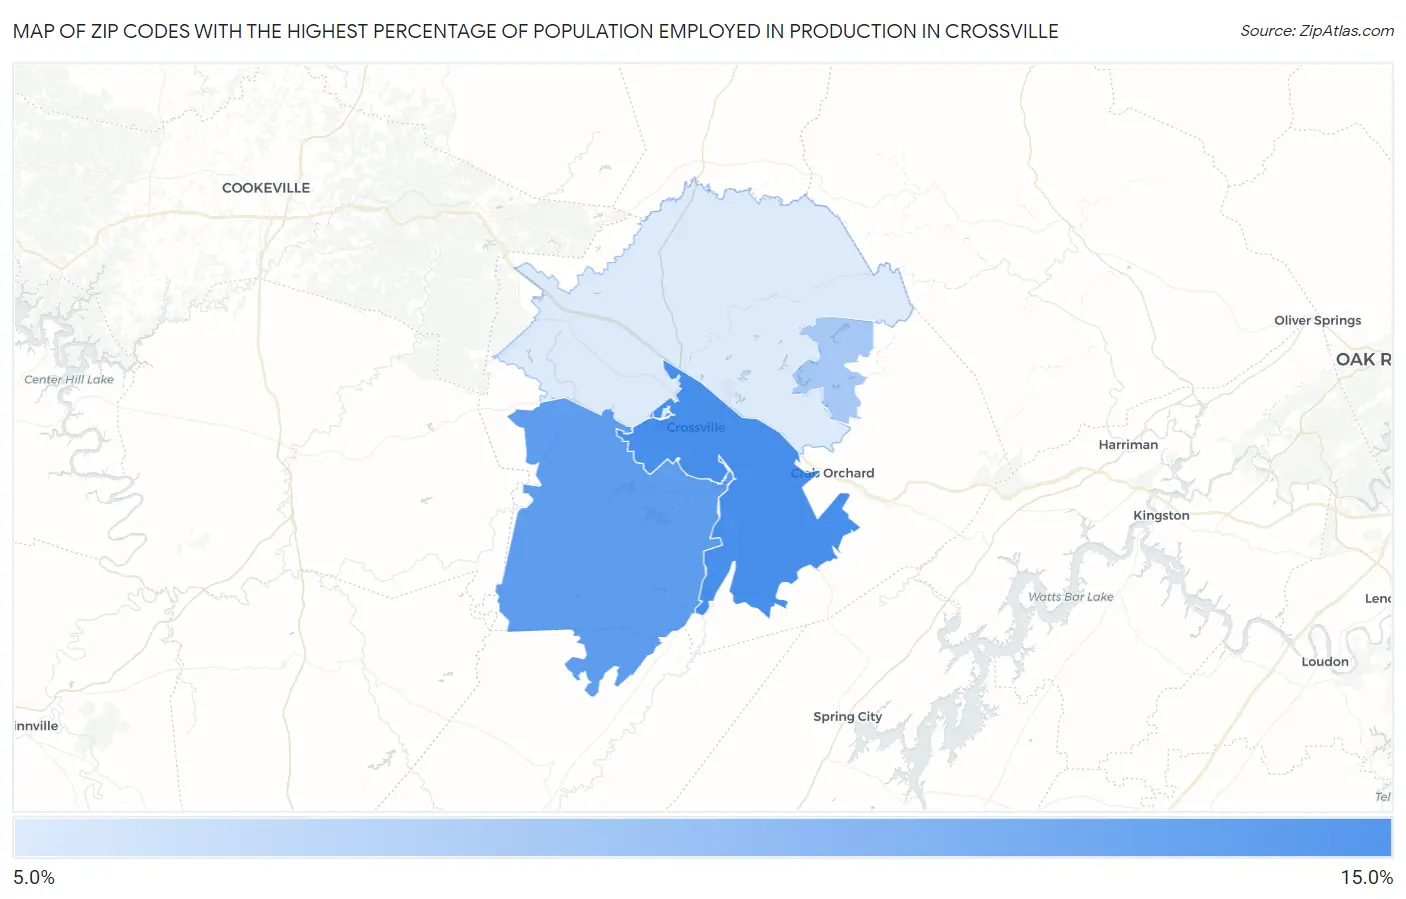
Zip Codes with the Highest Percentage of Population Employed in Production in Crossville, TN
RELATED REPORTS & OPTIONS
Production
Crossville
Compare Zip Codes
Map of Zip Codes with the Highest Percentage of Population Employed in Production in Crossville
6.2%
11.7%
Zip Codes with the Highest Percentage of Population Employed in Production in Crossville, TN
| Zip Code | % Employed | vs State | vs National | |
| 1. | 38555 | 11.7% | 7.7%(+3.93)#222 | 5.5%(+6.20)#5,787 |
| 2. | 38572 | 10.8% | 7.7%(+3.05)#249 | 5.5%(+5.33)#6,779 |
| 3. | 38558 | 8.2% | 7.7%(+0.448)#352 | 5.5%(+2.72)#10,696 |
| 4. | 38571 | 6.2% | 7.7%(-1.54)#443 | 5.5%(+0.738)#14,737 |
1
Common Questions
What are the Top 3 Zip Codes with the Highest Percentage of Population Employed in Production in Crossville, TN?
Top 3 Zip Codes with the Highest Percentage of Population Employed in Production in Crossville, TN are:
What zip code has the Highest Percentage of Population Employed in Production in Crossville, TN?
38555 has the Highest Percentage of Population Employed in Production in Crossville, TN with 11.7%.
What is the Percentage of Population Employed in Production in Crossville, TN?
Percentage of Population Employed in Production in Crossville is 13.9%.
What is the Percentage of Population Employed in Production in Tennessee?
Percentage of Population Employed in Production in Tennessee is 7.7%.
What is the Percentage of Population Employed in Production in the United States?
Percentage of Population Employed in Production in the United States is 5.5%.