Zip Codes with the Highest Percentage of Population with a Degree in Communications in Crossville, TN
RELATED REPORTS & OPTIONS
Communications
Crossville
Compare Zip Codes
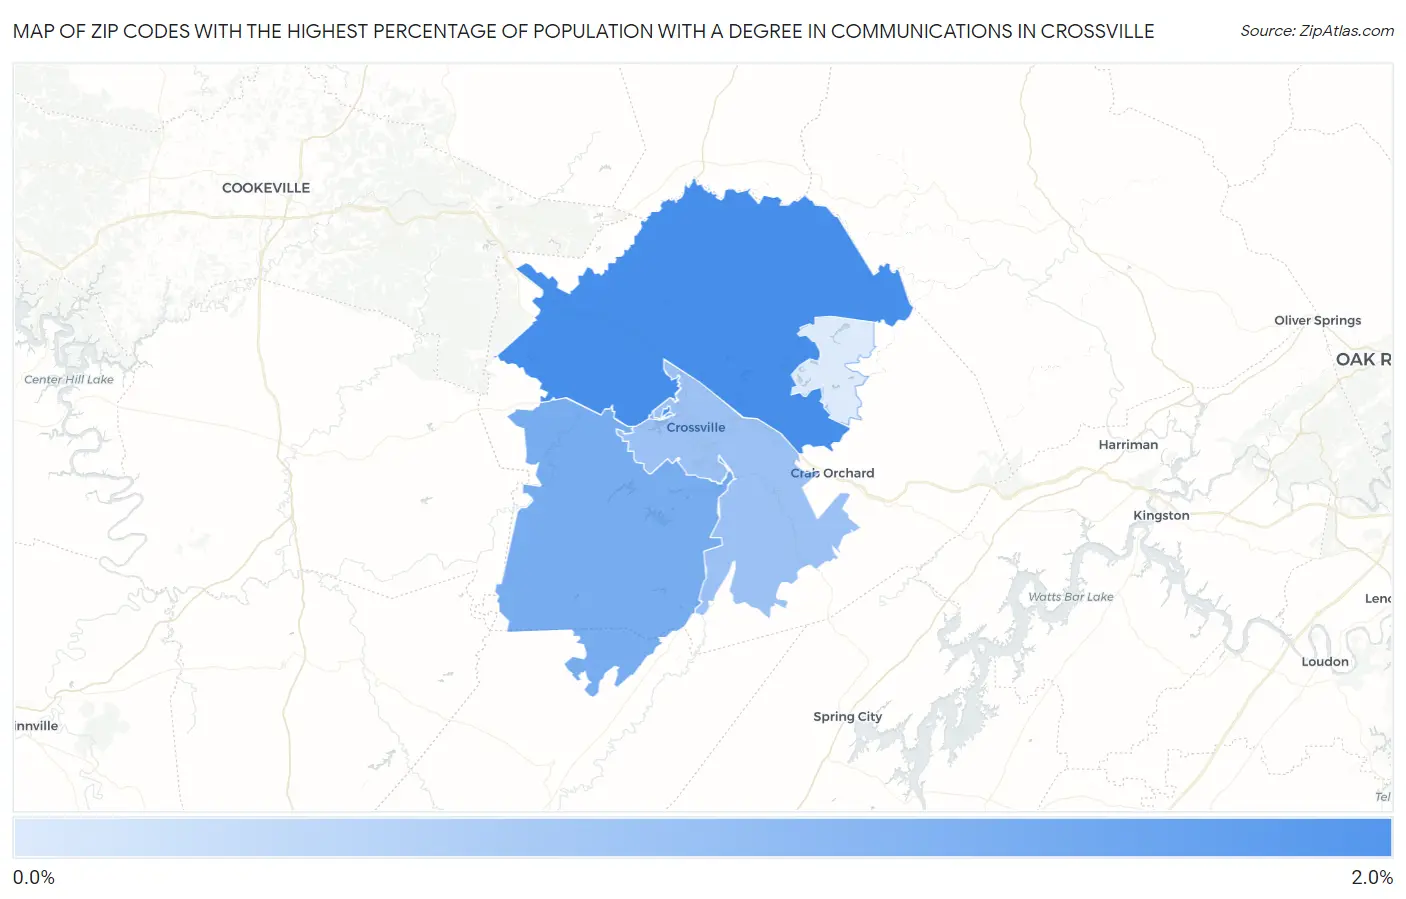
Map of Zip Codes with the Highest Percentage of Population with a Degree in Communications in Crossville
0.90%
1.9%
Zip Codes with the Highest Percentage of Population with a Degree in Communications in Crossville, TN
| Zip Code | % Graduates | vs State | vs National | |
| 1. | 38571 | 1.9% | 4.3%(-2.42)#307 | 4.1%(-2.27)#16,334 |
| 2. | 38572 | 1.6% | 4.3%(-2.73)#325 | 4.1%(-2.57)#17,327 |
| 3. | 38555 | 1.3% | 4.3%(-2.96)#338 | 4.1%(-2.81)#18,047 |
| 4. | 38558 | 0.90% | 4.3%(-3.38)#360 | 4.1%(-3.23)#19,247 |
1
Common Questions
What are the Top 3 Zip Codes with the Highest Percentage of Population with a Degree in Communications in Crossville, TN?
Top 3 Zip Codes with the Highest Percentage of Population with a Degree in Communications in Crossville, TN are:
What zip code has the Highest Percentage of Population with a Degree in Communications in Crossville, TN?
38571 has the Highest Percentage of Population with a Degree in Communications in Crossville, TN with 1.9%.
What is the Percentage of Population with a Degree in Communications in Crossville, TN?
Percentage of Population with a Degree in Communications in Crossville is 2.9%.
What is the Percentage of Population with a Degree in Communications in Tennessee?
Percentage of Population with a Degree in Communications in Tennessee is 4.3%.
What is the Percentage of Population with a Degree in Communications in the United States?
Percentage of Population with a Degree in Communications in the United States is 4.1%.