Zip Codes with the Highest Percentage of Households Heated without Fuel in Crossville, TN
RELATED REPORTS & OPTIONS
Fuel-less Heating
Crossville
Compare Zip Codes
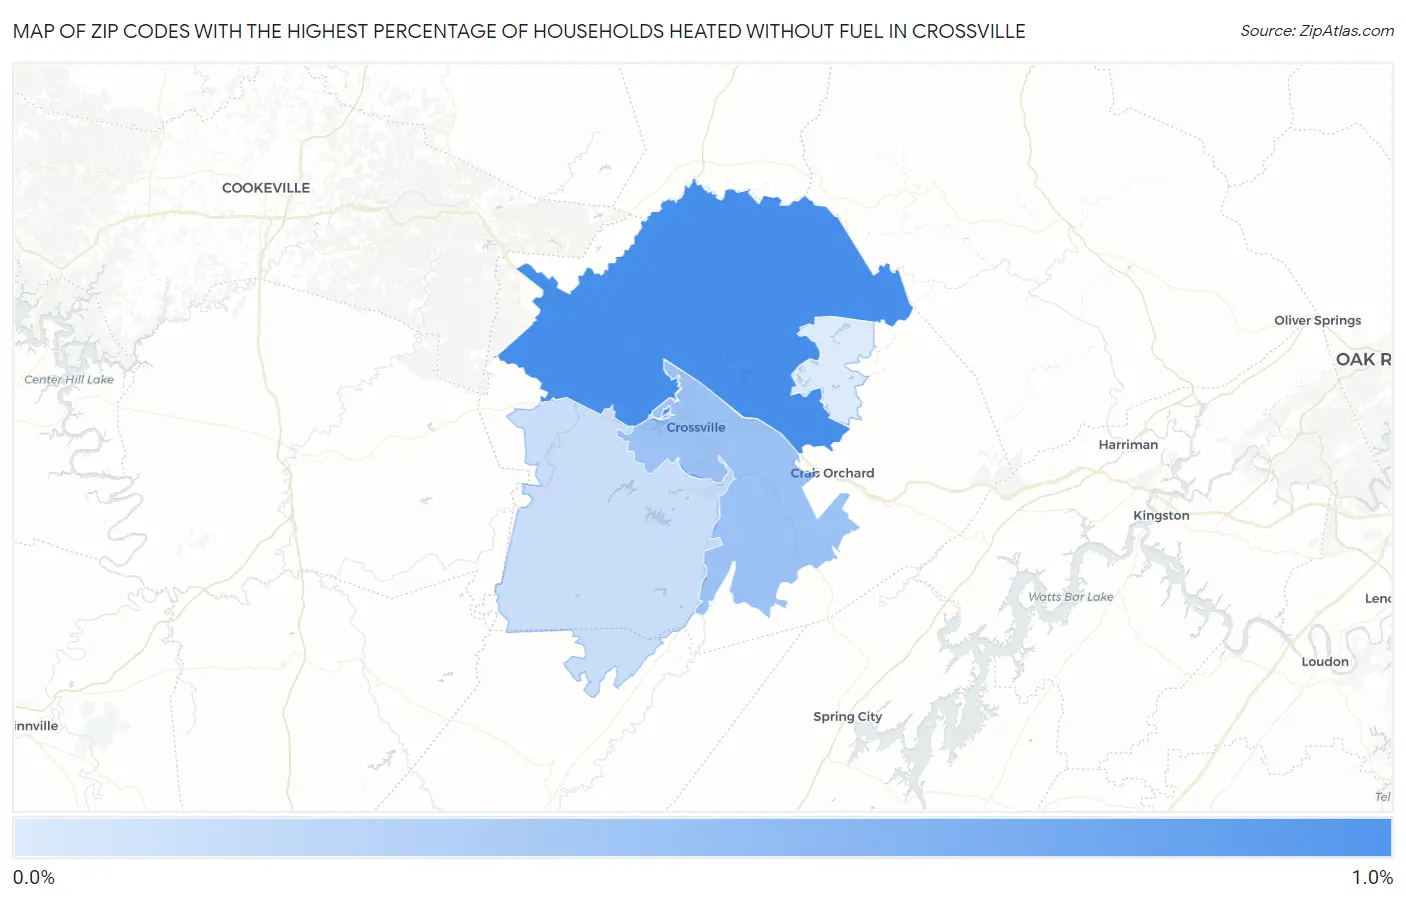
Map of Zip Codes with the Highest Percentage of Households Heated without Fuel in Crossville
0.30%
1.0%
Zip Codes with the Highest Percentage of Households Heated without Fuel in Crossville, TN
| Zip Code | Fuel-less Heating | vs State | vs National | |
| 1. | 38571 | 1.0% | 0.40%(+0.600)#69 | 1.2%(-0.200)#5,625 |
| 2. | 38555 | 0.60% | 0.40%(+0.200)#126 | 1.2%(-0.600)#8,525 |
| 3. | 38572 | 0.40% | 0.40%(=0.000)#184 | 1.2%(-0.800)#10,995 |
| 4. | 38558 | 0.30% | 0.40%(-0.100)#224 | 1.2%(-0.900)#12,478 |
1
Common Questions
What are the Top 3 Zip Codes with the Highest Percentage of Households Heated without Fuel in Crossville, TN?
Top 3 Zip Codes with the Highest Percentage of Households Heated without Fuel in Crossville, TN are:
What zip code has the Highest Percentage of Households Heated without Fuel in Crossville, TN?
38571 has the Highest Percentage of Households Heated without Fuel in Crossville, TN with 1.0%.
What is the Percentage of Households Heated without Fuel in Crossville, TN?
Percentage of Households Heated without Fuel in Crossville is 1.0%.
What is the Percentage of Households Heated without Fuel in Tennessee?
Percentage of Households Heated without Fuel in Tennessee is 0.40%.
What is the Percentage of Households Heated without Fuel in the United States?
Percentage of Households Heated without Fuel in the United States is 1.2%.