Zip Codes with the Highest Percentage of Immigrants from Guatemala in Crossville, TN
RELATED REPORTS & OPTIONS
Guatemala
Crossville
Compare Zip Codes
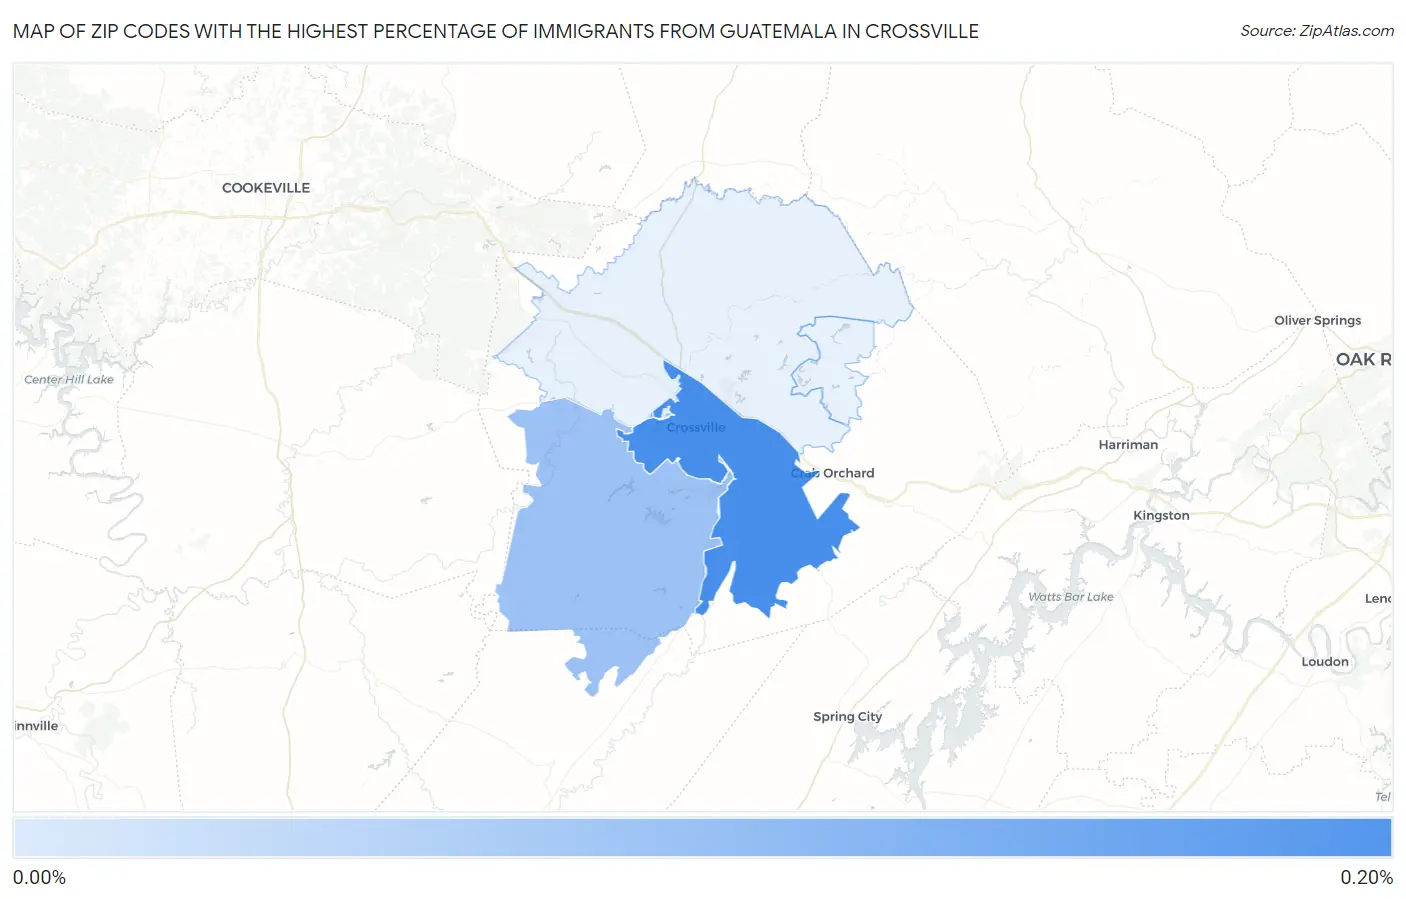
Map of Zip Codes with the Highest Percentage of Immigrants from Guatemala in Crossville
0.087%
0.20%
Zip Codes with the Highest Percentage of Immigrants from Guatemala in Crossville, TN
| Zip Code | Guatemala | vs State | vs National | |
| 1. | 38555 | 0.20% | 0.31%(-0.109)#-1 | 0.32%(-0.119)#0 |
| 2. | 38572 | 0.087% | 0.31%(-0.221)#0 | 0.32%(-0.231)#1 |
1
Common Questions
What are the Top 3 Zip Codes with the Highest Percentage of Immigrants from Guatemala in Crossville, TN?
Top 3 Zip Codes with the Highest Percentage of Immigrants from Guatemala in Crossville, TN are:
What zip code has the Highest Percentage of Immigrants from Guatemala in Crossville, TN?
38555 has the Highest Percentage of Immigrants from Guatemala in Crossville, TN with 0.20%.
What is the Percentage of Immigrants from Guatemala in Crossville, TN?
Percentage of Immigrants from Guatemala in Crossville is 0.36%.
What is the Percentage of Immigrants from Guatemala in Tennessee?
Percentage of Immigrants from Guatemala in Tennessee is 0.31%.
What is the Percentage of Immigrants from Guatemala in the United States?
Percentage of Immigrants from Guatemala in the United States is 0.32%.