Zip Codes with the Highest Percentage of Population Employed in Cleaning & Maintenance in Crossville, TN
RELATED REPORTS & OPTIONS
Cleaning & Maintenance
Crossville
Compare Zip Codes
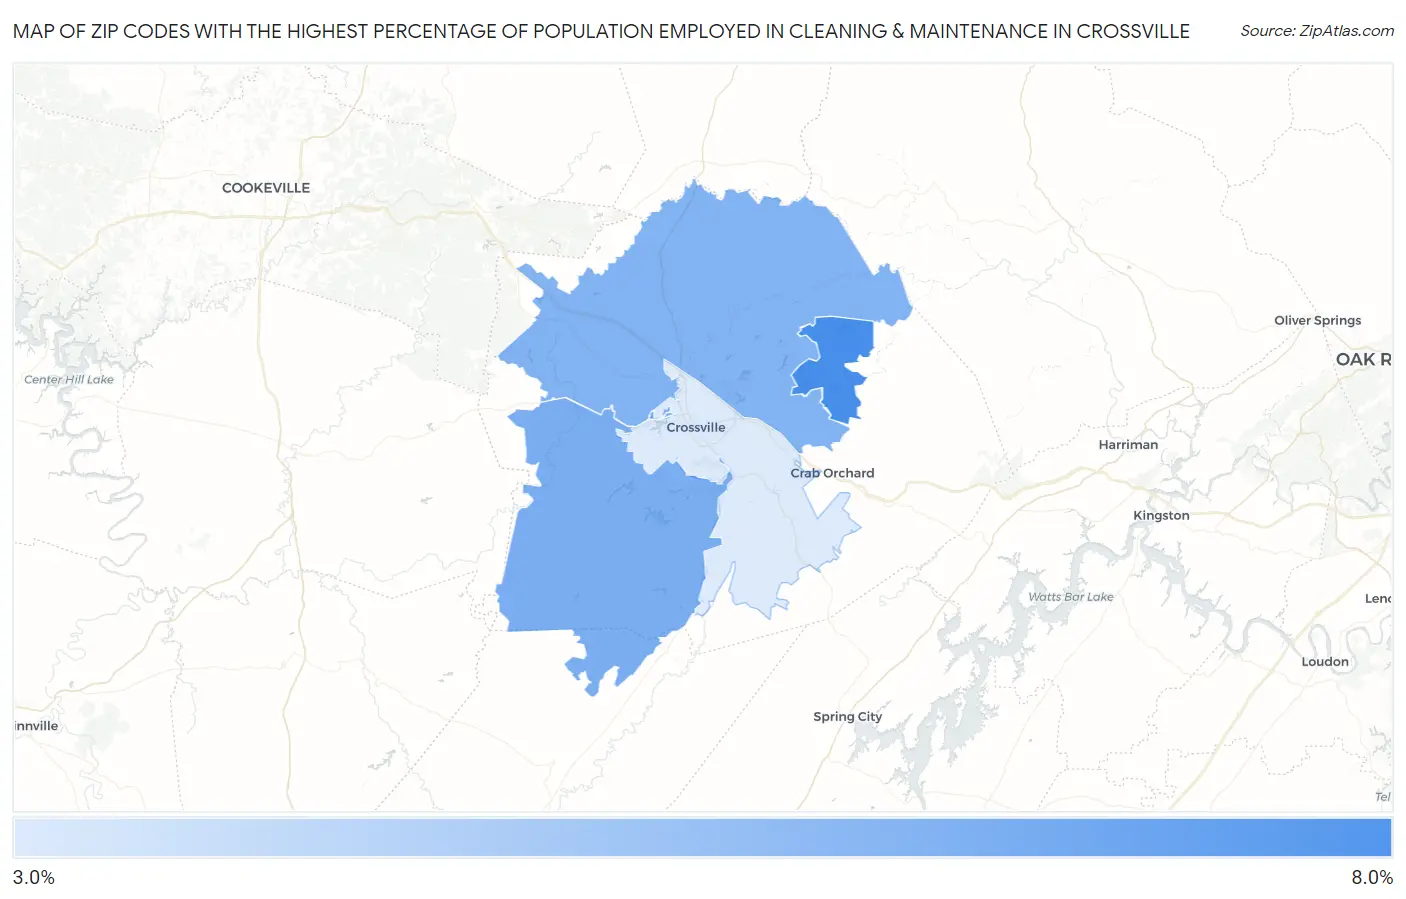
Map of Zip Codes with the Highest Percentage of Population Employed in Cleaning & Maintenance in Crossville
3.1%
6.0%
Zip Codes with the Highest Percentage of Population Employed in Cleaning & Maintenance in Crossville, TN
| Zip Code | % Employed | vs State | vs National | |
| 1. | 38558 | 6.0% | 3.4%(+2.63)#106 | 3.5%(+2.55)#5,581 |
| 2. | 38572 | 5.0% | 3.4%(+1.62)#152 | 3.5%(+1.54)#7,909 |
| 3. | 38571 | 4.9% | 3.4%(+1.49)#160 | 3.5%(+1.41)#8,270 |
| 4. | 38555 | 3.1% | 3.4%(-0.307)#307 | 3.5%(-0.389)#15,395 |
1
Common Questions
What are the Top 3 Zip Codes with the Highest Percentage of Population Employed in Cleaning & Maintenance in Crossville, TN?
Top 3 Zip Codes with the Highest Percentage of Population Employed in Cleaning & Maintenance in Crossville, TN are:
What zip code has the Highest Percentage of Population Employed in Cleaning & Maintenance in Crossville, TN?
38558 has the Highest Percentage of Population Employed in Cleaning & Maintenance in Crossville, TN with 6.0%.
What is the Percentage of Population Employed in Cleaning & Maintenance in Crossville, TN?
Percentage of Population Employed in Cleaning & Maintenance in Crossville is 4.1%.
What is the Percentage of Population Employed in Cleaning & Maintenance in Tennessee?
Percentage of Population Employed in Cleaning & Maintenance in Tennessee is 3.4%.
What is the Percentage of Population Employed in Cleaning & Maintenance in the United States?
Percentage of Population Employed in Cleaning & Maintenance in the United States is 3.5%.