Zip Codes with the Highest Percentage of Population Employed in Transportation & Warehousing in Crossville, TN
RELATED REPORTS & OPTIONS
Transportation & Warehousing
Crossville
Compare Zip Codes
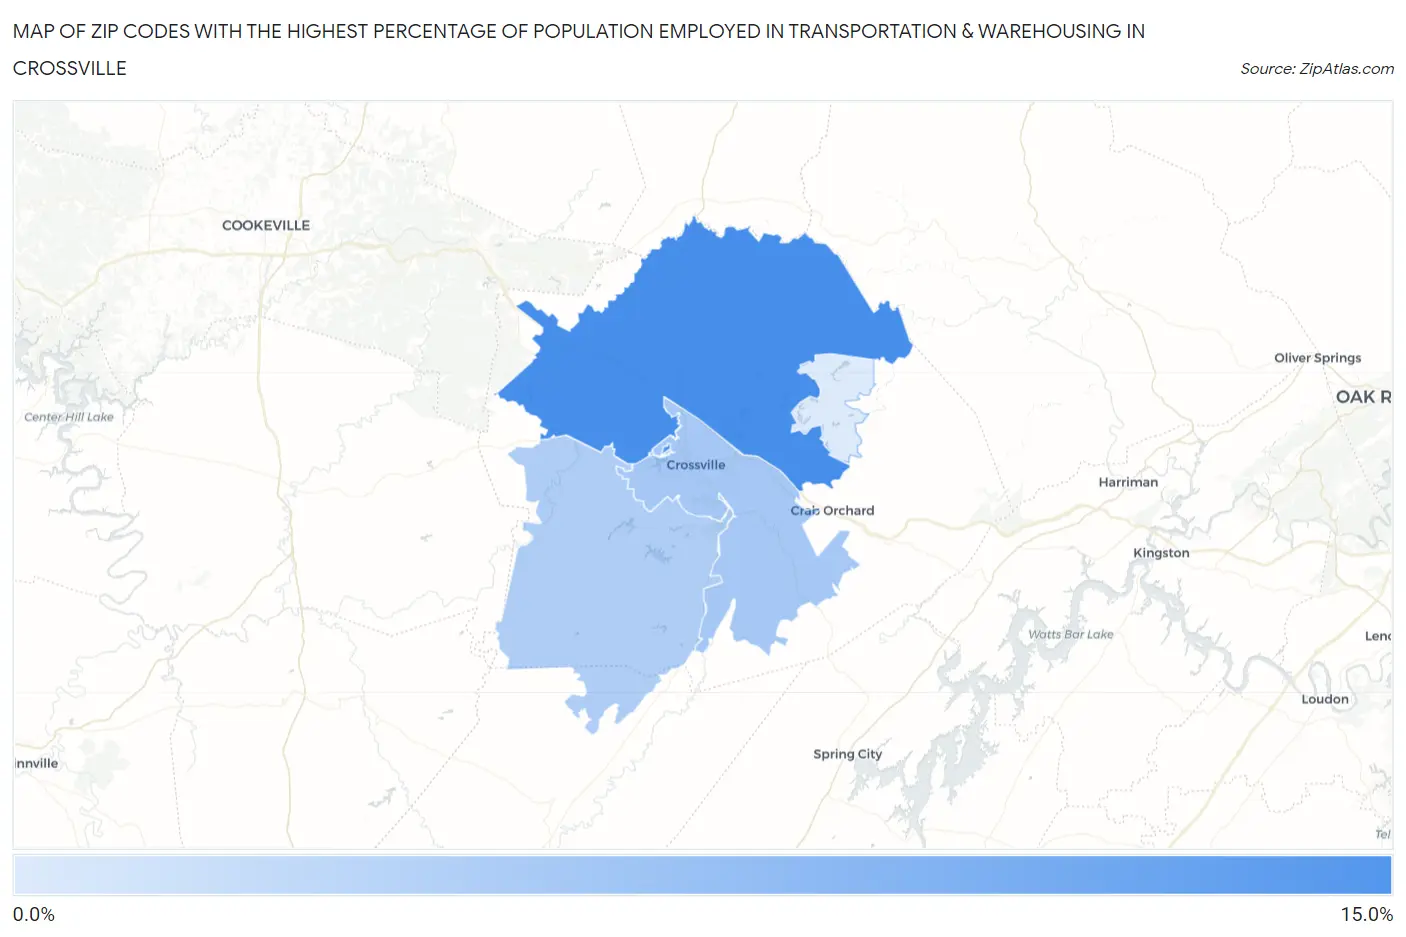
Map of Zip Codes with the Highest Percentage of Population Employed in Transportation & Warehousing in Crossville
3.6%
12.0%
Zip Codes with the Highest Percentage of Population Employed in Transportation & Warehousing in Crossville, TN
| Zip Code | % Employed | vs State | vs National | |
| 1. | 38571 | 12.0% | 6.1%(+5.89)#56 | 4.9%(+7.06)#1,851 |
| 2. | 38555 | 6.7% | 6.1%(+0.588)#177 | 4.9%(+1.75)#7,162 |
| 3. | 38572 | 6.2% | 6.1%(+0.048)#216 | 4.9%(+1.21)#8,384 |
| 4. | 38558 | 3.6% | 6.1%(-2.48)#424 | 4.9%(-1.31)#17,523 |
1
Common Questions
What are the Top 3 Zip Codes with the Highest Percentage of Population Employed in Transportation & Warehousing in Crossville, TN?
Top 3 Zip Codes with the Highest Percentage of Population Employed in Transportation & Warehousing in Crossville, TN are:
What zip code has the Highest Percentage of Population Employed in Transportation & Warehousing in Crossville, TN?
38571 has the Highest Percentage of Population Employed in Transportation & Warehousing in Crossville, TN with 12.0%.
What is the Percentage of Population Employed in Transportation & Warehousing in Crossville, TN?
Percentage of Population Employed in Transportation & Warehousing in Crossville is 7.4%.
What is the Percentage of Population Employed in Transportation & Warehousing in Tennessee?
Percentage of Population Employed in Transportation & Warehousing in Tennessee is 6.1%.
What is the Percentage of Population Employed in Transportation & Warehousing in the United States?
Percentage of Population Employed in Transportation & Warehousing in the United States is 4.9%.