Zip Codes with the Highest Percentage of Population Employed in Firefighting & Prevention in Crossville, TN
RELATED REPORTS & OPTIONS
Firefighting & Prevention
Crossville
Compare Zip Codes
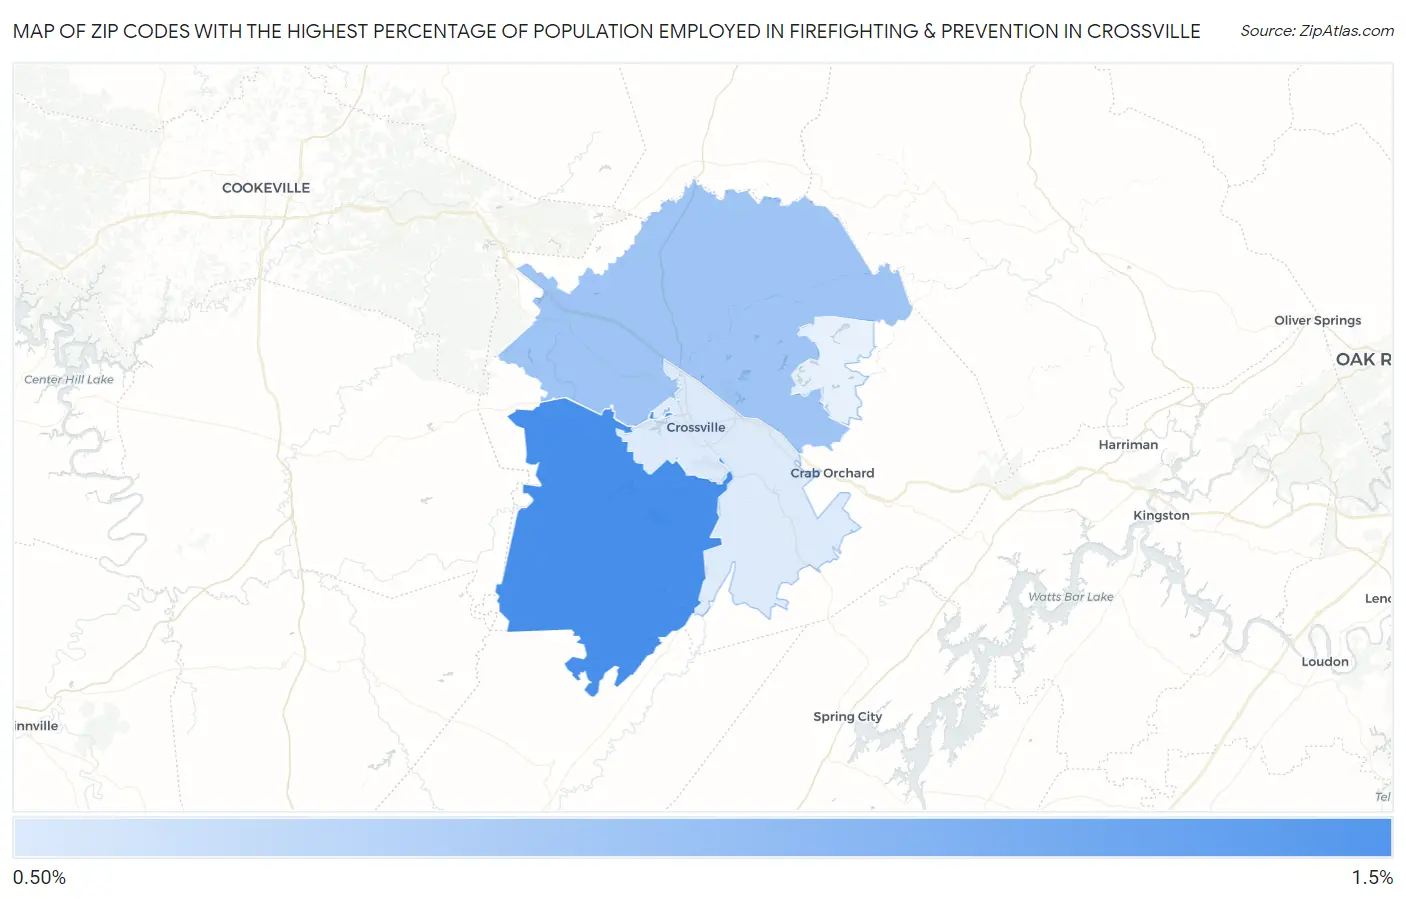
Map of Zip Codes with the Highest Percentage of Population Employed in Firefighting & Prevention in Crossville
0.90%
1.3%
Zip Codes with the Highest Percentage of Population Employed in Firefighting & Prevention in Crossville, TN
| Zip Code | % Employed | vs State | vs National | |
| 1. | 38572 | 1.3% | 1.1%(+0.175)#167 | 1.2%(+0.087)#8,564 |
| 2. | 38571 | 1.1% | 1.1%(-0.044)#215 | 1.2%(-0.132)#10,565 |
| 3. | 38555 | 0.90% | 1.1%(-0.196)#243 | 1.2%(-0.284)#12,151 |
1
Common Questions
What are the Top 3 Zip Codes with the Highest Percentage of Population Employed in Firefighting & Prevention in Crossville, TN?
Top 3 Zip Codes with the Highest Percentage of Population Employed in Firefighting & Prevention in Crossville, TN are:
What zip code has the Highest Percentage of Population Employed in Firefighting & Prevention in Crossville, TN?
38572 has the Highest Percentage of Population Employed in Firefighting & Prevention in Crossville, TN with 1.3%.
What is the Percentage of Population Employed in Firefighting & Prevention in Crossville, TN?
Percentage of Population Employed in Firefighting & Prevention in Crossville is 1.3%.
What is the Percentage of Population Employed in Firefighting & Prevention in Tennessee?
Percentage of Population Employed in Firefighting & Prevention in Tennessee is 1.1%.
What is the Percentage of Population Employed in Firefighting & Prevention in the United States?
Percentage of Population Employed in Firefighting & Prevention in the United States is 1.2%.