Zip Codes with the Highest Percentage of Population with a Degree in Liberal Arts and History in Crossville, TN
RELATED REPORTS & OPTIONS
Liberal Arts and History
Crossville
Compare Zip Codes
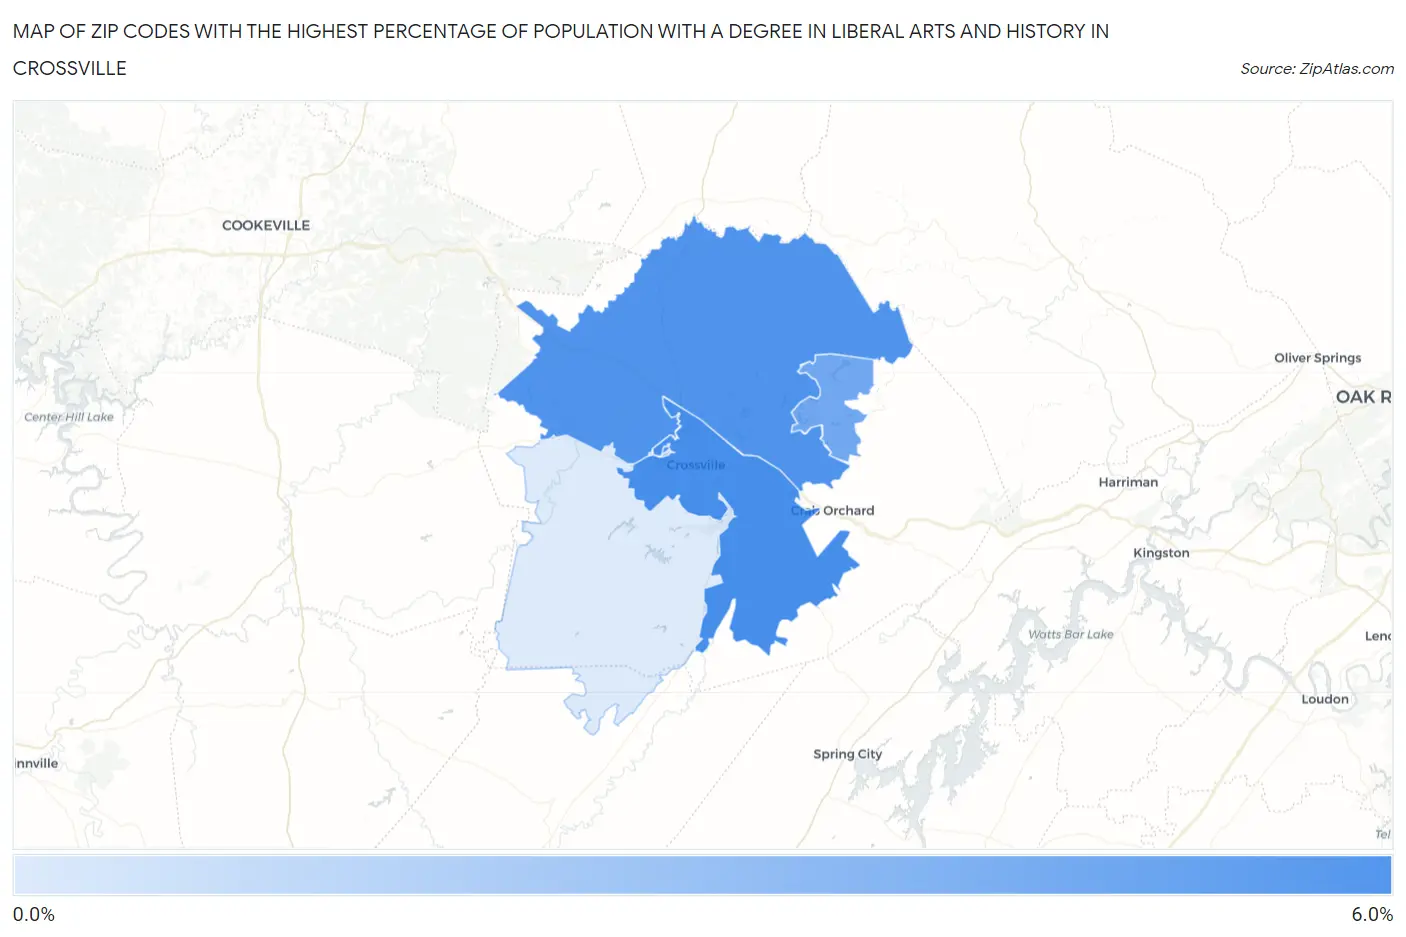
Map of Zip Codes with the Highest Percentage of Population with a Degree in Liberal Arts and History in Crossville
0.35%
5.5%
Zip Codes with the Highest Percentage of Population with a Degree in Liberal Arts and History in Crossville, TN
| Zip Code | % Graduates | vs State | vs National | |
| 1. | 38555 | 5.5% | 4.9%(+0.648)#197 | 4.9%(+0.655)#9,798 |
| 2. | 38571 | 5.2% | 4.9%(+0.334)#208 | 4.9%(+0.340)#10,689 |
| 3. | 38558 | 4.1% | 4.9%(-0.783)#294 | 4.9%(-0.776)#14,424 |
| 4. | 38572 | 0.35% | 4.9%(-4.52)#476 | 4.9%(-4.52)#24,123 |
1
Common Questions
What are the Top 3 Zip Codes with the Highest Percentage of Population with a Degree in Liberal Arts and History in Crossville, TN?
Top 3 Zip Codes with the Highest Percentage of Population with a Degree in Liberal Arts and History in Crossville, TN are:
What zip code has the Highest Percentage of Population with a Degree in Liberal Arts and History in Crossville, TN?
38555 has the Highest Percentage of Population with a Degree in Liberal Arts and History in Crossville, TN with 5.5%.
What is the Percentage of Population with a Degree in Liberal Arts and History in Crossville, TN?
Percentage of Population with a Degree in Liberal Arts and History in Crossville is 4.3%.
What is the Percentage of Population with a Degree in Liberal Arts and History in Tennessee?
Percentage of Population with a Degree in Liberal Arts and History in Tennessee is 4.9%.
What is the Percentage of Population with a Degree in Liberal Arts and History in the United States?
Percentage of Population with a Degree in Liberal Arts and History in the United States is 4.9%.