Zip Codes with the Highest Percentage of Population Employed in Computer & Mathematics in Lebanon, PA
RELATED REPORTS & OPTIONS
Computer & Mathematics
Lebanon
Compare Zip Codes
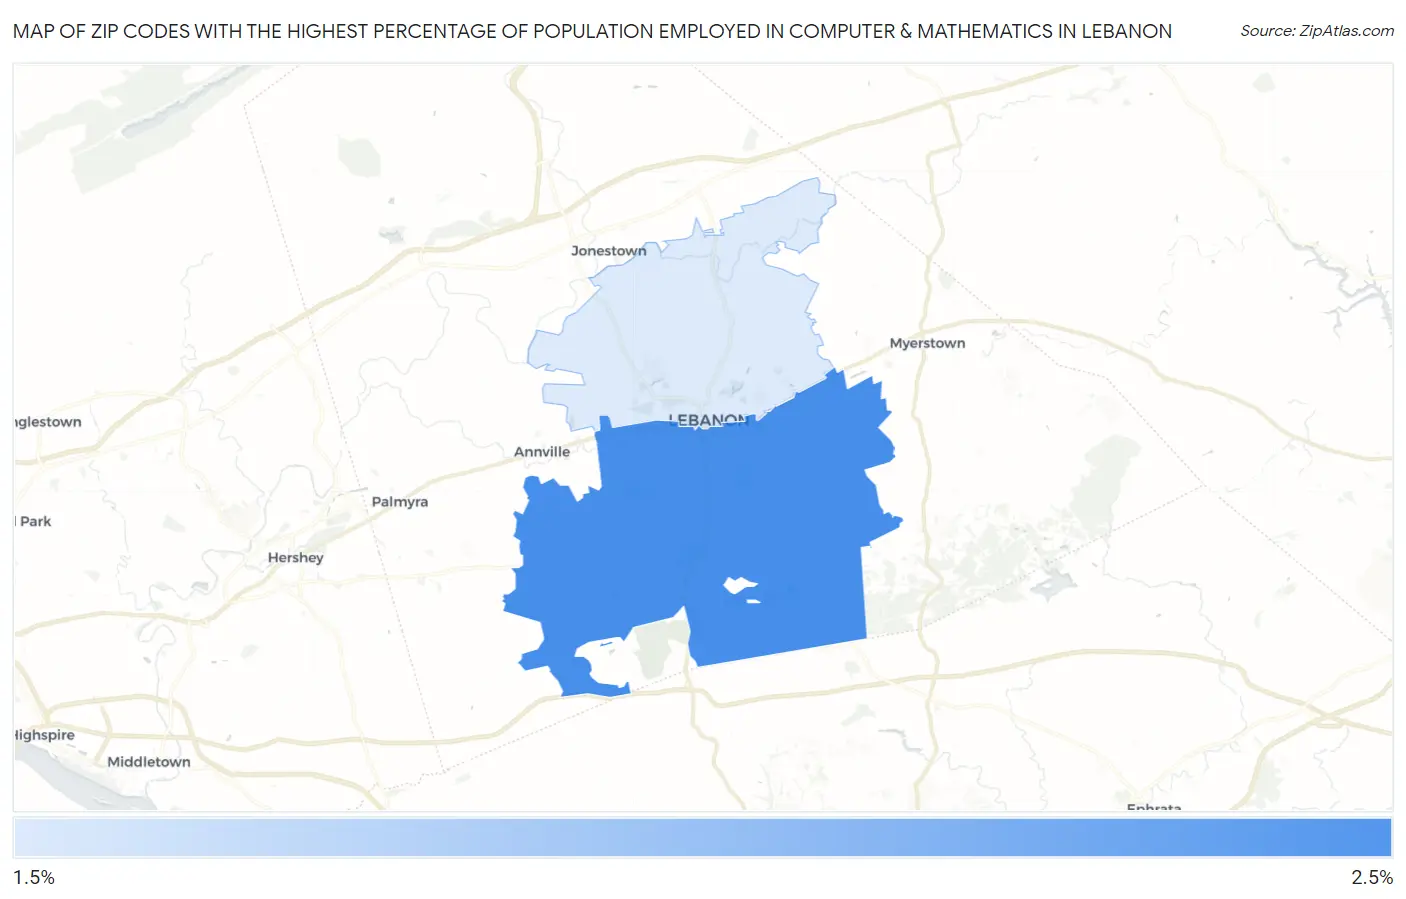
Map of Zip Codes with the Highest Percentage of Population Employed in Computer & Mathematics in Lebanon
2.0%
2.4%
Zip Codes with the Highest Percentage of Population Employed in Computer & Mathematics in Lebanon, PA
| Zip Code | % Employed | vs State | vs National | |
| 1. | 17042 | 2.4% | 3.3%(-0.851)#558 | 3.5%(-1.10)#9,944 |
| 2. | 17046 | 2.0% | 3.3%(-1.26)#645 | 3.5%(-1.51)#11,742 |
1
Common Questions
What are the Top Zip Codes with the Highest Percentage of Population Employed in Computer & Mathematics in Lebanon, PA?
Top Zip Codes with the Highest Percentage of Population Employed in Computer & Mathematics in Lebanon, PA are:
What zip code has the Highest Percentage of Population Employed in Computer & Mathematics in Lebanon, PA?
17042 has the Highest Percentage of Population Employed in Computer & Mathematics in Lebanon, PA with 2.4%.
What is the Percentage of Population Employed in Computer & Mathematics in Lebanon, PA?
Percentage of Population Employed in Computer & Mathematics in Lebanon is 2.2%.
What is the Percentage of Population Employed in Computer & Mathematics in Pennsylvania?
Percentage of Population Employed in Computer & Mathematics in Pennsylvania is 3.3%.
What is the Percentage of Population Employed in Computer & Mathematics in the United States?
Percentage of Population Employed in Computer & Mathematics in the United States is 3.5%.