Zip Codes with the Highest Percentage of Population Employed in Computer & Mathematics in Danville, PA
RELATED REPORTS & OPTIONS
Select to Compare
Danville
Compare Zip Codes
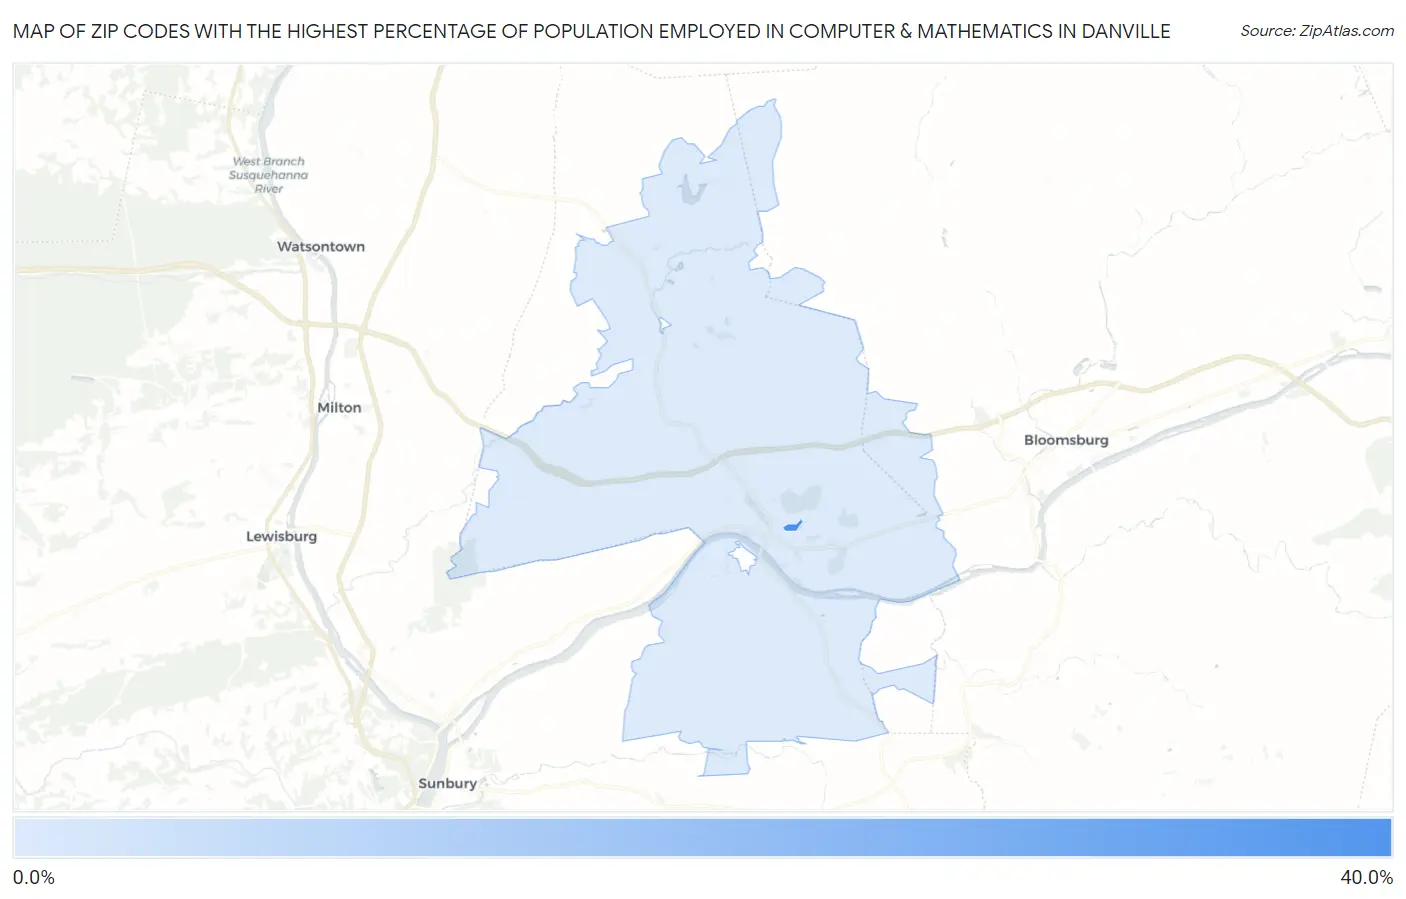
Map of Zip Codes with the Highest Percentage of Population Employed in Computer & Mathematics in Danville
2.4%
37.5%
Zip Codes with the Highest Percentage of Population Employed in Computer & Mathematics in Danville, PA
| Zip Code | % Employed | vs State | vs National | |
| 1. | 17822 | 37.5% | 3.3%(+34.2)#2 | 3.5%(+34.0)#25 |
| 2. | 17821 | 2.4% | 3.3%(-0.847)#557 | 3.5%(-1.10)#9,924 |
1
Common Questions
What are the Top Zip Codes with the Highest Percentage of Population Employed in Computer & Mathematics in Danville, PA?
Top Zip Codes with the Highest Percentage of Population Employed in Computer & Mathematics in Danville, PA are:
What zip code has the Highest Percentage of Population Employed in Computer & Mathematics in Danville, PA?
17822 has the Highest Percentage of Population Employed in Computer & Mathematics in Danville, PA with 37.5%.
What is the Percentage of Population Employed in Computer & Mathematics in Pennsylvania?
Percentage of Population Employed in Computer & Mathematics in Pennsylvania is 3.3%.
What is the Percentage of Population Employed in Computer & Mathematics in the United States?
Percentage of Population Employed in Computer & Mathematics in the United States is 3.5%.