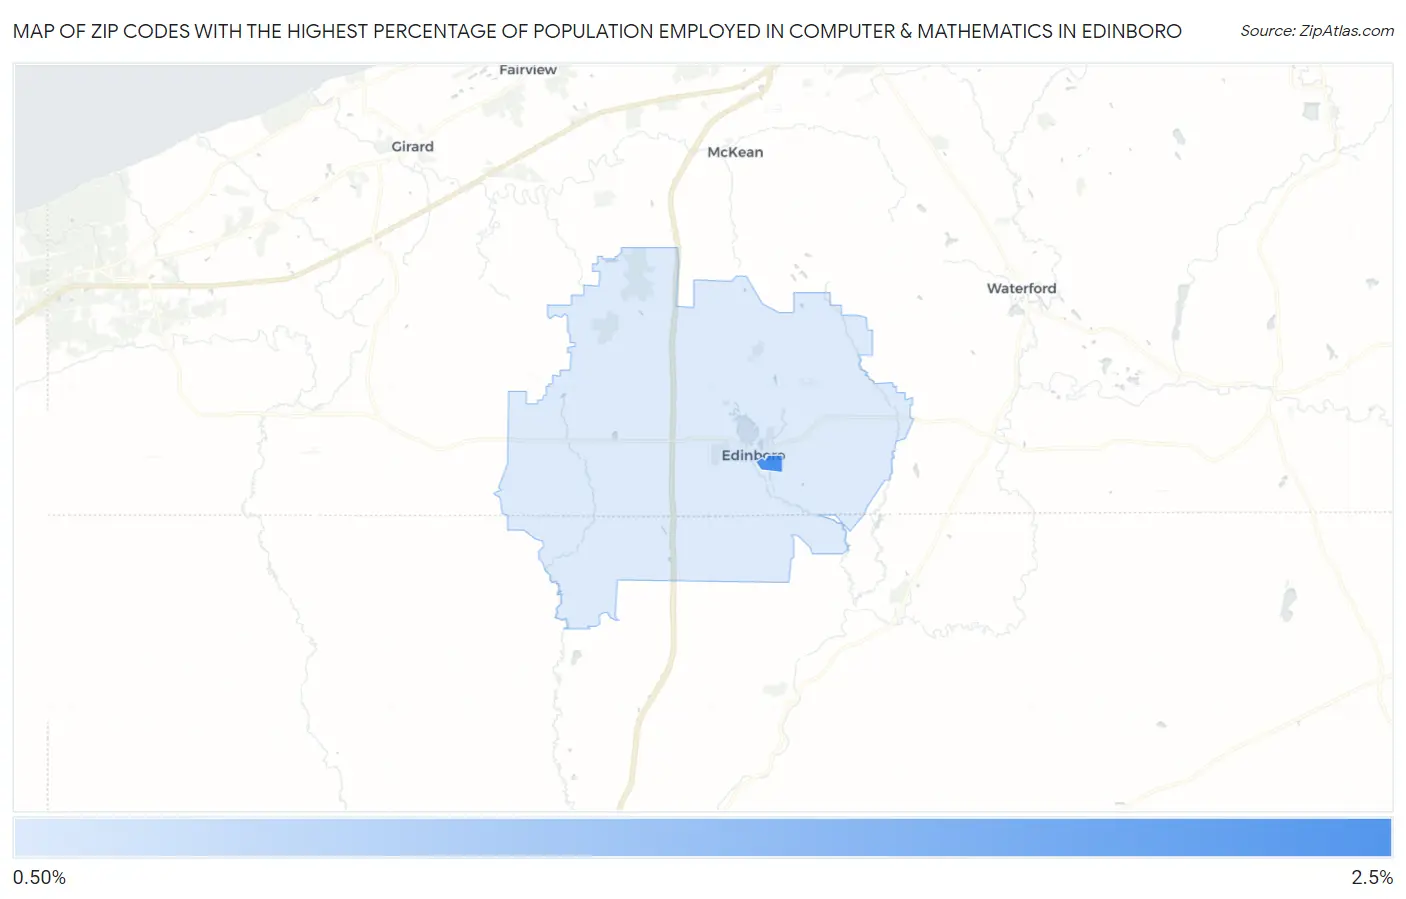
Zip Codes with the Highest Percentage of Population Employed in Computer & Mathematics in Edinboro, PA
RELATED REPORTS & OPTIONS
Computer & Mathematics
Edinboro
Compare Zip Codes
Map of Zip Codes with the Highest Percentage of Population Employed in Computer & Mathematics in Edinboro
0.63%
2.4%
Zip Codes with the Highest Percentage of Population Employed in Computer & Mathematics in Edinboro, PA
| Zip Code | % Employed | vs State | vs National | |
| 1. | 16444 | 2.4% | 3.3%(-0.837)#553 | 3.5%(-1.09)#9,884 |
| 2. | 16412 | 0.63% | 3.3%(-2.64)#1,080 | 3.5%(-2.89)#19,658 |
1
Common Questions
What are the Top Zip Codes with the Highest Percentage of Population Employed in Computer & Mathematics in Edinboro, PA?
Top Zip Codes with the Highest Percentage of Population Employed in Computer & Mathematics in Edinboro, PA are:
What zip code has the Highest Percentage of Population Employed in Computer & Mathematics in Edinboro, PA?
16444 has the Highest Percentage of Population Employed in Computer & Mathematics in Edinboro, PA with 2.4%.
What is the Percentage of Population Employed in Computer & Mathematics in Pennsylvania?
Percentage of Population Employed in Computer & Mathematics in Pennsylvania is 3.3%.
What is the Percentage of Population Employed in Computer & Mathematics in the United States?
Percentage of Population Employed in Computer & Mathematics in the United States is 3.5%.