Zip Codes with the Highest Percentage of Population with a Degree in Visual and Performing Arts in Warren, OH
RELATED REPORTS & OPTIONS
Visual and Performing Arts
Warren
Compare Zip Codes
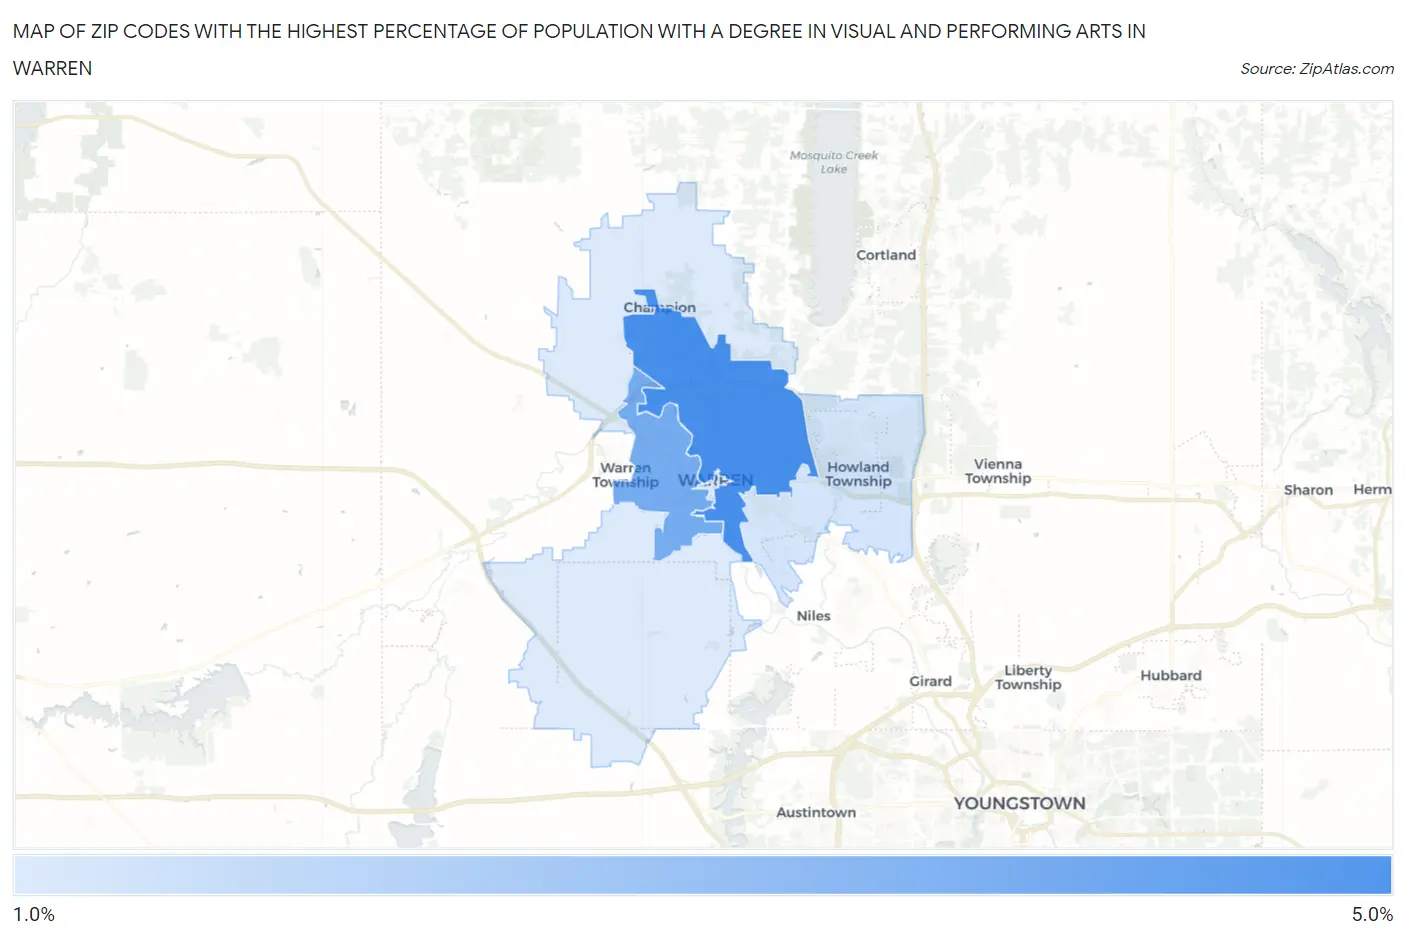
Map of Zip Codes with the Highest Percentage of Population with a Degree in Visual and Performing Arts in Warren
1.5%
4.0%
Zip Codes with the Highest Percentage of Population with a Degree in Visual and Performing Arts in Warren, OH
| Zip Code | % Graduates | vs State | vs National | |
| 1. | 44483 | 4.0% | 3.7%(+0.334)#322 | 4.3%(-0.207)#9,104 |
| 2. | 44485 | 3.2% | 3.7%(-0.475)#423 | 4.3%(-1.02)#11,851 |
| 3. | 44484 | 1.6% | 3.7%(-2.10)#655 | 4.3%(-2.64)#17,808 |
| 4. | 44481 | 1.5% | 3.7%(-2.25)#668 | 4.3%(-2.79)#18,296 |
1
Common Questions
What are the Top 3 Zip Codes with the Highest Percentage of Population with a Degree in Visual and Performing Arts in Warren, OH?
Top 3 Zip Codes with the Highest Percentage of Population with a Degree in Visual and Performing Arts in Warren, OH are:
What zip code has the Highest Percentage of Population with a Degree in Visual and Performing Arts in Warren, OH?
44483 has the Highest Percentage of Population with a Degree in Visual and Performing Arts in Warren, OH with 4.0%.
What is the Percentage of Population with a Degree in Visual and Performing Arts in Warren, OH?
Percentage of Population with a Degree in Visual and Performing Arts in Warren is 2.9%.
What is the Percentage of Population with a Degree in Visual and Performing Arts in Ohio?
Percentage of Population with a Degree in Visual and Performing Arts in Ohio is 3.7%.
What is the Percentage of Population with a Degree in Visual and Performing Arts in the United States?
Percentage of Population with a Degree in Visual and Performing Arts in the United States is 4.3%.